Best Start Of The Year In Decades!
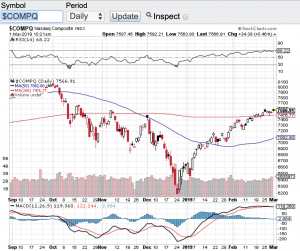
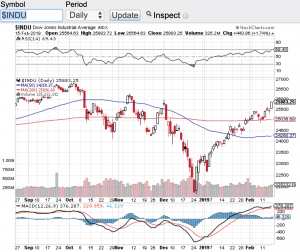
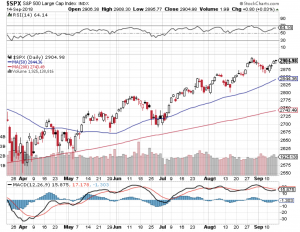
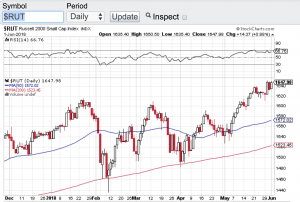
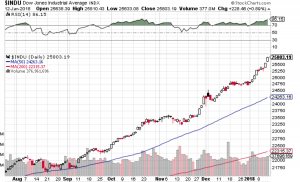
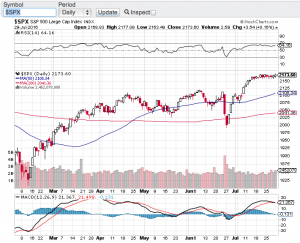
Stocks have opened the month of March rip roaring again adding to the best start of the year for the averages in decades. The Dow Jones Industrial Average (see chart here) opened the trading day up over 200 points, the S&P 500 (see chart here) opened up over 20 points, the Nasdaq Composite (see chart below) opened up over 55 points and the small-cap Russell 2000 (see chart here) opened up over 11 points. These gains are adding to the double digits percentage gains the markets have already realized in 2019.
So why such a strong start to the year? I am not trying to sound like a broken record but this 10 year long bull market is a head scratcher. No matter what has been thrown at one of the longest bull markets in history, nothing seems have an adverse affect. You name the crises and stocks shrug it off. Whether it is a geopolitical event, the Federal Reserve raising rates or the daily chaos that comes out of Washington, nothing has disrupted this incessant rise in stocks. We did get a definitive correction late last year in where the bears came out of hibernation and predicted the end of the bull market and that a 40% correction is now imminent. Well don’t look now but we are not too far off from setting new all time highs in the aforementioned indexes.
Technically speaking it appears that the coast is clear for now as well. All of the major averages are now trading above their respective 20-day, 50-day and 200 day moving averages which is a very bullish sign. The one caveat to the technical shape of the market is that stocks are a bit overextended. Overbought conditions do exist technically and according to the relative strength index also known as the RSI. That said, the pullbacks that do occur continue to be met with support with buyers stepping in willing to add to their existing positions or open up new positions. The trend remains your friend in our current environment. Good luck to all 🙂
~George