Q3 earnings reporting season has just begun and early on earnings are coming in better than expected. Almost 15% of the S&P 500 have reported their latest quarterly earnings and over 80% of that group have beat expectations. Included in this group that have already reported are Netflix (Nasdaq: NFLX), Bank of America (NYSE: BAC), JP Morgan Chase (NYSE: JPM), and Morgan Stanley (NYSE: MS) just to name a few. A look ahead to next week and hundreds of companies are set to report including but not limited to Halliburton (NYSE: HAL), TD Ameritrade (Nasdaq: AMTD), Biogen (Nasdaq:BIIB), Discover Financial Services (NYSE: DFS), Harley-Davidson (NYSE: HOG), McDonald’s Corp (NYSE: MCD), Proctor and Gamble (NYSE: PG), United Parcel Service (NYSE: UPS), Boeing Co (NYSE: BA), Caterpillar (NYSE: CAT). eBay (Nasdaq: EBAY), Ford Motor Co. (NYSE: F), Las Vegas Sands Corp (NYSE: LVS), Microsoft (Nasdaq:MSFT), O’Reilly Automotive (Nasdaq:ORLY), Paypal Holdings (Nasdaq:PYPL), Spirit Airlines (NYSE: SAVE), Tesla (Nasdaq: TSLA), Xilinx (Nasdaq: XLNX), 3M Co (NYSE: MMM), Aflac Inc (NYSE: AFL), American Airlines Group (Nasdaq: AAL), Capital One Financial Corp (NYSE: COF), Citrix Systems (Nasdaq: CTXS), Deckers Outdoor Corp (NYSE: DECK), First Solar (Nasdaq: FSLR), Gilead Sciences (Nasdaq: GILD), Southwest Airlines (NYSE: LUV), T-Mobile (Nasdaq: TMUS), Twitter (NYSE: TWTR), Visa Inc (NYSE: V), Goodyear Tire & Rubber (NYSE: GT), Phillips 66 (NYSE: PSX), and Royal Caribbean Cruises (NYSE: RCL). Hundreds more companies are set to report but you get the picture.
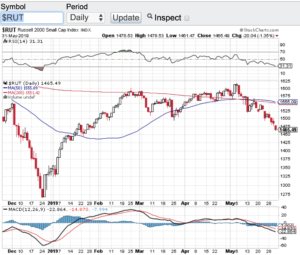
So with earning reporting season kicking into high gear, let’s see how investors continue to respond. On the week the Dow Jones Industrial Average (chart) closed at 26770, the S&P 500 (chart) closed just under the 3000 mark, the Nasdaq Composite (chart) closed at 8089 and the small-cap Russell 2000 (chart) closed the week at 1535. With the exception of today’s pullback the aforementioned indexes have all been in a recent uptrend. I think it is safe to say that next week’s earnings results will play a role in the markets direction.
Good luck to all 🙂
~George