No Surprise Here…

It’s no surprise here that the month of August was weak for the overall stock market. Despite the current economic backdrop historically August tends to underperform compared to the rest of the year. The Dow Jones Industrial Average (see chart here) last month closed down over 1000 points and the S&P 500 (see chart here) closed below the 4000 mark. The Nasdaq Composite (see chart here) gave up over 500 points and the small-cap Russell 2000 (see chart here) pulled back slightly. That being said and considering the current headwinds we are facing I believe stocks held up pretty well.

Now that we are in September and from a seasonal perspective especially with mid-terms approaching, I anticipate volatility to continue. There is also a possibility that vol will accelerate. Looking at the current backdrop, we have a Federal Reserve that continues to raise interest rates, corporate earnings are stagnating and the political situation in our country is nothing to be proud of now. Taking all of these factors into consideration, plus the constant flow of negative news, August could off sold off a lot more. Out of all these dynamics I prefer to tune out most all of the noise and really study how the Federal Reserve is navigating itself through this cycle. To me it is this entity that swings the biggest bat on how the markets move. As you know by now, I also pay attention to the technical shape of the key indexes.

Speaking of the technical shape of the market, let’s take a look. The Dow Jones Industrial Average (see chart here) is trading below its 20 day, 100 and 200 day moving averages. The S&P 500 (see chart here) is also experiencing a technically weak pattern as is the Nasdaq Composite (see chart here) and the Russell 2000 (see chart here). Again, no surprise here but I did notice the markets today appeared to find some support. For the markets the dog days of summer are almost over, but I think we all need to buckle up between now and the mid-terms because I do expect volatility to continue.

Good luck to all and have a great and safe Labor Day Holiday!

~George
The New Norm…

I think it is becoming safe to say that we are now in the new norm! The stock market for over a decade has feasted on the Federal Reserve’s accommodative policies and most recently the stimulus provided by governments from around the world during the pandemic. Under normal market conditions, stocks trade on their own merits and prospects. This has simply not been the case in years. Fast forward to today and we now have a Federal Reserve raising interest rates, reducing their own stimulus programs to stave off inflation and get back to more normalized Fed policies and procedures. Now the markets are taking notice. Volatility in the markets continue as has been the case for months now. Year to date, the Dow Jones Industrial Average (see chart here) is down 10 percent, the S&P 500 (see chart here) is lower by 15%, the Nasdaq Composite (see chart here) on the year is down almost 25% and the small-cap Russell 2000 (see chart here) is down about 18%.

Yes, I believe we have entered a new norm. Which isn’t necessarily a bad thing from the standpoint of properly evaluating companies. What’s been very difficult during the past decade or so is how to evaluate public companies. The Federal Reserve and its unprecedented accommodative monetary policies was a huge driver of how companies were valued. Meaning this, when there are hardly any choices of attaining yield whether it is from stocks or bonds, this forces capital into the stock market or other higher risk assets. This has been one of the primary drivers of the incessant bull market investors have enjoyed over the years. Now, companies are going to have to perform to maintain their position in the marketplace. The ones that do, will be rewarded, the ones that don’t will experience adjustments in their valuations.

With all the above being said, I am confident that once the stock market bottoms out, there will be great opportunities to consider and act on. Good luck to all 🙂

~George

Record After Record!

The U.S. stock market notched record after record in 2021! What a year for all asset classes from stocks, to real estate, to the crypto markets!

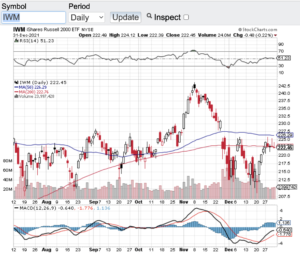
The Dow Jones Industrial Average (see chart here) finished 2021 up 18.7%. The S&P 500 (see chart here) closed the year out up a whopping 27%. The Nasdaq Composite (see chart here) closed up 21.5% and the small-cap Russell 2000 (see chart here) closed 2021 up 13.7%. How counterintuitive are these results as our country and the world for that matter continues to face and deal with Covid-19. Covid is now entering its 3rd year with the latest variant taking the world by storm. The omicron variant are causing infection rates to soar. However, scientists are hopeful that this variant could be the catalyst to ending this pandemic due to how less virulent this variant is at least to the fully vaccinated. It’s still early but the way omicron has now seemingly and abruptly reversed its course in South Africa, there is hope that this will be the case everywhere else.

Back to the markets. As we enter 2022 the big question and maybe the only question the markets have is how aggressive will the Federal Reserve be in hiking interest rates. No question in the new year interest rates will begin to head north. Inflation is soaring and impacting almost everything, which is part of the reason why we are seeing all-time highs across the board. This is not sustainable and with interest rates on the verge of increasing, stocks will face their first true test as the tightening rolls out. That said and because the pandemic is still wreaking havoc, I do not expect the Fed will be too aggressive out of the gate.

Let’s look at the technical shape of the aforementioned indexes. The Dow Jones Industrial Average (see chart here) is comfortably trading above its 100 and 200-day moving averages as is the S&P 500 (see chart here) and the Nasdaq Composite (see chart here). The small-cap Russell 2000 (see chart below) is trading at it 100 and 200 day MA so let’s see if these support lines hold for the Russell. The other technical indicator that I prefer is the relative strength index aka the RSI and none of the aforementioned indexes are in overbought territory according to the RSI. The 70 value level of the RSI is considered overbought and the 30 value level is considered oversold and each index is trading right around the middle of that range.

Happy New Year!

~George

Record After Record! - Paula Mahfouz


Healthy Corrective Action – Or Something More?

Are we in a healthy correction or is this something more? The recent market selloff including yesterday’s 500 point drop on the Dow Jones Industrial Average (see chart here) has caught the attention of investors and traders alike. The S&P 500 (see chart here) experienced its toughest month in over a year closing down almost 5%. The Nasdaq Composite (see chart here) was lower by over 5% in the month of September. It is not too surprising that the major averages were weaker to close out the third quarter. Historically, September and October for that matter are usually softer months for stocks.

So back to the question is this healthy corrective action or the beginning of a meaningful drawdown? The answer depends on who you ask or how you are interpreting the Federal Reserve’s updated guidance to the monetary policies that the Fed has in place. It is hard to be bearish here based on where the Federal Reserve currently stands. In one breath we hear that “bond purchases” will start to taper off before year end. Then in another breath, the Fed continues to signal that they are prepared to support our economy in the event we experience another surge in Covid. My feelings are the Fed will not put the brakes on their easy monetary policies until such time that our country is out of this pandemic. One thing is for sure, each upcoming Fed policy meeting and subsequent guidance will be put under a microscope more now than ever.

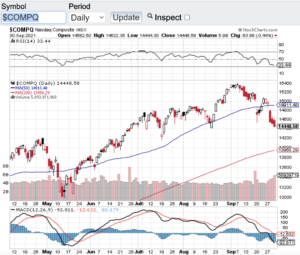
Let’s take a quick gander at the technical shape of the aforementioned indexes. The Dow Jones Industrial Average (see chart here) closed yesterday just below 34000 with its 200-day moving average currently at 33360. The S&P 500 (see chart here) closed yesterday at 4307 while also breaching and closing below its 100-day moving average. The Nasdaq Composite (see chart below) closed the month of September at 14448 also breaching its 100-day moving average. So the current technical set up could mean more downside ahead, but on the other hand, if these moving averages hold and acts as support, we could see a strong relief rally.

Good luck to all 🙂

~George

Healthy Corrective Action - Or Something More? - Paula Mahfouz


53 Record Highs And Counting…

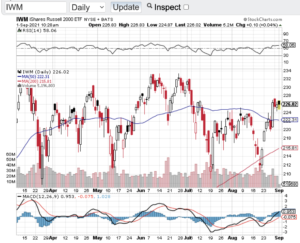
The S&P 500 (see chart here) has hit 53 record highs so far in 2021 and counting. That’s right folks 53 all-time highs this year alone. The Nasdaq Composite (see chart here) has logged 32 record highs in 2021 as well. The Dow Jones Industrial Average (see chart here) has also been on fire trading above the 35000 level and the small-cap Russell 2000 (see chart below) continues to perform alongside the aforementioned bellwether indexes. How much longer can this bull run? I think it began with the Federal Reserve and its longstanding monetary policies and now there seems to be a subtle change in the Fed’s position.

Last Friday at the Federal Reserve’s Jackson Hole Economic Symposium, Fed Reserve chairman Jerome Powell signaled again that the Fed would soon begin to pullback on its $120B per month bond asset purchases. This support to the markets and the economy along with a zero percent interest rate backdrop has been THE catalyst to support record high after record high in our stock market. Of course the massive economic stimulus packages that have been disseminated since the start of the pandemic has also played a role in consumer spending which has also propelled stocks to new heights.

Now we all know this cannot go on forever. Free money, zero percent interest rates, asset purchases and the like will end at some point in time. The question then becomes what happens to the stock market when all of this support winds down? Friends the answer is simple. Corporate America is going to have to produce on its own. Meaning this, for the continuation of this decade long bull market, companies will have to not only have to catch up with their current valuations they will have to exceed expectations going forward. This will certainly separate real growth companies from the rest of the pack and that’s when we just may see a more normal ebb and flow in our markets. Good luck to all 🙂 and have a safe and Happy Labor Day weekend.

~George

53 In a Row And Counting - Paula Mahfouz


Risk On Remains On!

Risk on in the markets remains on as we approach the second half of the year! It’s truly remarkable to me how stocks, crypto, real estate and other asset classes are still trading at or near all time highs. I do get that the ongoing accommodative policies provided by our Federal Reserve and from central banks across the globe is the main reason why asset prices continue their bullish ways.

That said, I do think it is time to start considering how things could look once the Federal Reserve in our country starts backing away from its accommodative monetary policies and as interest rates begin to normalize. This is not a question of if, it’s a question of when. Tell tale signs of inflation are now seemingly everywhere which is what the Federal Reserve is paying close attention to and could be the catalyst for the Fed to act. It is at this point our markets could be adjusting to align with real interest rates and normalized price to earning multiples. To that end, we have and continue to witness the most unique market conditions ever seen. So I am not calling a top here and I do respect the power of the Federal Reserve, however, I am just suggesting that we may see a healthy and overdue adjustment in asset prices which may not be such a bad thing. There are many investors that are on the sidelines and would be more than happy to step in should we see asset prices adjust to a lower entry point.

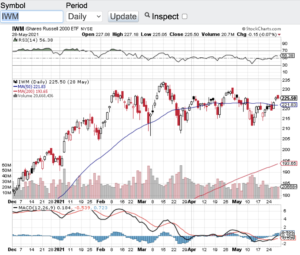
Let’s take a quick look at the technical shape of the major averages. The Dow Jones Industrial Average (see chart here), the S&P 500 (see chart here), the Nasdaq Composite (see chart here) and the Small Cap Russell 2000 (see chart below) all are trading above their 20, 100 and 200 day moving averages. This alone is a strong technical backdrop and what’s more is none of the aforementioned indexes are currently overbought according to the relative strength index aka the RSI. So technically speaking things look pretty good right now.

Good luck to all 🙂

~George

Risk On Remains On - Paula Mahfouz


Stocks Have Gone Wild!

Stocks have gone wild since the election with the Dow Jones Industrial Average (see chart here) breaking the 30000 level for the first time ever last week! This morning the S&P 500 (see chart here) hit its all time high trading above 3660. The Nasdaq Composite (see chart here) is also trading at its all time high and the small-cap Russell 2000 (see chart here) has also recently hit an all time high.

So why all of this love for stocks while we are in such a tumultuous time? I think it is safe to say that the Federal Reserve continues to play a major role in this never ending rally. Essentially zero percent interest rates, massive stimulus packages along with asset purchases remains the top catalysts for these record setting ways. The ironic part of disasters and catastrophes is the willingness and capabilities of central banks to step in to offset the negative economic impact of such catastrophes. COVID-19 has shocked the world and has lead to widespread unemployment, while devastating businesses and industries alike. Never before have we seen such widespread effects on life as we know it. The good news now is there is light at the end of the tunnel. The recent news on the advancements with vaccines and their effectiveness is very encouraging. Some pundits are now saying we could be at herd immunity by the summer of 2021. Let’s hope this is the case.

Now this is where things can get tricky for the markets. As the light at the end of the tunnel gets brighter, what happens when the Federal Reserve begins to change its stance on accommodative policies? The Fed backstop will not last forever. The risk here is that when the Federal Reserve signals a change in direction, it is then that the markets will become more tethered to actual corporate earnings power. So if you stay long this market or if you are adding on new positions, it would be a good idea to make sure you are invested in companies and sectors that have earnings power and continuing growth prospects.

Good luck to all 🙂

~George

The Best Quarter For The Major Averages In Decades!

We just witnessed the best quarter in the major averages in decades. Yes folks it is hard to believe that stocks are performing the in way that they are with all things considered. The Dow Jones Industrial Average (see chart here) is trading near the 26,000 level, the S&P 500 (see chart here) is trading this morning at the 3,120 level, the Nasdaq Composite (see chart here) is back over the 10,000 mark and the small-cap Russell 2000 (see chart here) is trading in the 1,450 zone.

The strength of stocks in general is one for the ages. I don’t think anyone would of thought that the markets would continue to show this type of resilience especially with the backdrop of our current unemployment picture and with Covid continuing to run rampant. The only logical reason as to why the Dow Jones Industrial average is not sub 20,000, has to be the continuing liquidity that is coming into the markets provided by Federal Reserve and the government stimulus packages that have launched since the crisis began. Of course there are select tech and pharmaceutical companies that are directly benefiting from the new world we find ourselves but I didn’t expect to see such a wide swath of stocks doing well in this current environment.

Now that the 3rd quarter of the year has begun I think all eyes will begin to focus on second quarter earnings results which kicks off next week. What’s even more important in my eyes is the energy, spirit and guidance that comes out of companies during their earnings conference calls. I am expecting companies to either pull their future guidance or lower earnings expectations, we shall see. Another catalyst that I expect to play a role in how the markets will fare here in Q3 is how the Presidential polls continue to unfold. Currently Joe Biden has a double digit lead over Donald Trump. Some pundits are saying that the markets are beginning to price in a Biden win. Candidate Biden has already stated that he will raise the capital gains and corporate taxes should he become President. If this is the case, higher taxes would negatively affect net earnings but this scenario could be offset by other positive geo-political factors should Biden win.

Good luck to all 🙂

~George

A Breakout Or A Fake-out?

The major averages seemingly are on the verge of a breakout, or could it be a fake-out? The Dow Jones Industrial Average (see chart here) has recaptured the 25000 level. The S&P 500 (see chart here) has recaptured the 3000 level. The Nasdaq Composite (see chart here) believe it or not is in striking distance of its all-time high and the small-cap Russell 2000 (see chart below) is also setting up for a breakout on its own. It is beyond impressive how the markets have come roaring back since late February. There are certain pundits out there that believe that this is a classic bear market rally however to me it feels like more than that. I have to believe that one of the main reasons why stocks have come roaring back in such a short period of time is the $ trillions of dollars in liquidity that the Federal Reserve and our government has injected into the markets and the economy. In fact, the Federal Reserve has quietly indicated that it is possible that they themselves would buy stocks if needed. Talk about establishing a floor in the stock market!

Another key development in the markets is how strong the technicals look right now. Without a doubt the leadership group of this recent rally is the Nasdaq Composite (see chart here). Tech stocks have benefited the most due to the lockdown. There are more people online than ever before, hence more sales accordingly. Since mid-April, not only has the Nasdaq cleared its 200-day moving average, it also has cleared its 50, 100 and 20-day moving averages. So now the Nasdaq is trading above all of its key moving averages which is bullish. Furthermore, the Dow Jones Industrial Average (see chart here) the S&P 500 (see chart here) and the small-cap Russell 2000 have also broken above some key technical resistance levels. Another technical indicator I look at the relative strength index also known as the RSI. At this point in time the aforementioned indexes are not in overbought territory. The RSI is a momentum indicator and when the value level of the RSI goes above 70 stocks or indexes begin to become overbought. This is currently not the case.

Good luck to all 🙂

~George

A Breakout Or A Fake-out - Paula Mahfouz


A Stunning Comeback!

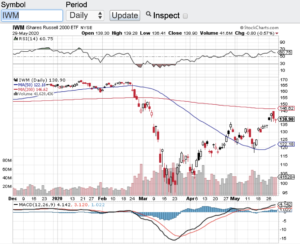
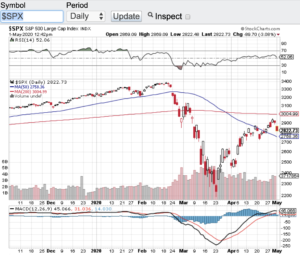
Stocks pulled off one of the most stunning comebacks in recent memory. Despite Covid-19’s rapid acceleration which is afflicting millions, the stock market made one of the sharpest and quickest recoveries off of the bottom we hit in late March. The Dow Jones Industrial Average (see chart here) gained over 11% in April, the S&P 500 (see chart below) posted a 12.7% gain, the Nasdaq Composite (see chart here) closed up over 15% and the small-cap Russell 2000 (see chart here) posted a whopping 22% gain in the month of April. Let’s not forget we are still off of the all time highs set earlier in the year but I don’t think anyone expected the magnitude of the rally that we just witnessed. There is no question that hopes of re-opening the economy and the latest advancements on therapeutic treatments and vaccines also played a role in the April rally.

Let’s look at it deeper than the just scientific advancements. The Federal Reserve actions and the recent stimulus packages issued by our government has also played a significant role in the eye-popping rally. With all of constant news flow and developments that comes out on Covid, I do think it is hard to realize how impactful the government stimulus packages and the new Federal Reserve stance is and what it does mean to the economy and markets now and going forward. I think it is fair to assume that once there is a definitive and stabilizing solution for the Covid crisis, that our economy and markets should have no problem taking off again. Until then, let’s all pray for a rapid solution to this ugly virus that has wreaked havoc on society. I do believe and have always believed in humanity and for science to lead the way.

Let’s take a quick look at the current technical shape of the the key indexes. We can all expect the markets to pull back after such a sharp bounce back rally. This is the case as I write my blog today. The markets are pulling back to their 20-day moving averages. Typically the 20-day, 50-day and especially the 200-day moving average acts as near term support levels. Let’s see if the current 20-day moving average holds as a near term support level as we head into the weekend.

Good luck to all 🙂

~George

A Stunning Comeback - Paula Mahfouz