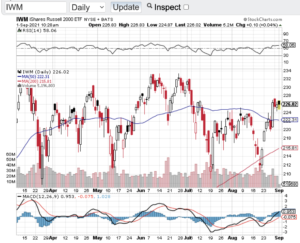
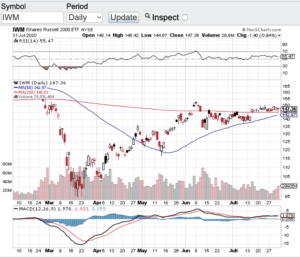
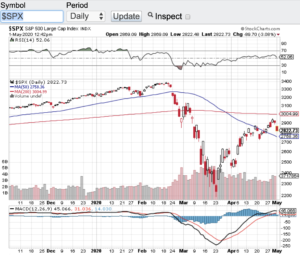
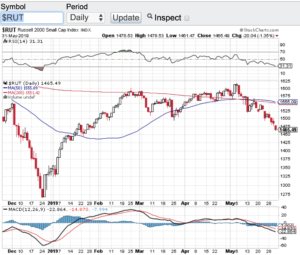
The Best Quarter For The Major Averages In Decades!

We just witnessed the best quarter in the major averages in decades. Yes folks it is hard to believe that stocks are performing the in way that they are with all things considered. The Dow Jones Industrial Average (see chart here) is trading near the 26,000 level, the S&P 500 (see chart here) is trading this morning at the 3,120 level, the Nasdaq Composite (see chart here) is back over the 10,000 mark and the small-cap Russell 2000 (see chart here) is trading in the 1,450 zone.

The strength of stocks in general is one for the ages. I don’t think anyone would of thought that the markets would continue to show this type of resilience especially with the backdrop of our current unemployment picture and with Covid continuing to run rampant. The only logical reason as to why the Dow Jones Industrial average is not sub 20,000, has to be the continuing liquidity that is coming into the markets provided by Federal Reserve and the government stimulus packages that have launched since the crisis began. Of course there are select tech and pharmaceutical companies that are directly benefiting from the new world we find ourselves but I didn’t expect to see such a wide swath of stocks doing well in this current environment.

Now that the 3rd quarter of the year has begun I think all eyes will begin to focus on second quarter earnings results which kicks off next week. What’s even more important in my eyes is the energy, spirit and guidance that comes out of companies during their earnings conference calls. I am expecting companies to either pull their future guidance or lower earnings expectations, we shall see. Another catalyst that I expect to play a role in how the markets will fare here in Q3 is how the Presidential polls continue to unfold. Currently Joe Biden has a double digit lead over Donald Trump. Some pundits are saying that the markets are beginning to price in a Biden win. Candidate Biden has already stated that he will raise the capital gains and corporate taxes should he become President. If this is the case, higher taxes would negatively affect net earnings but this scenario could be offset by other positive geo-political factors should Biden win.

Good luck to all 🙂

~George

A Stunning Comeback!

Stocks pulled off one of the most stunning comebacks in recent memory. Despite Covid-19’s rapid acceleration which is afflicting millions, the stock market made one of the sharpest and quickest recoveries off of the bottom we hit in late March. The Dow Jones Industrial Average (see chart here) gained over 11% in April, the S&P 500 (see chart below) posted a 12.7% gain, the Nasdaq Composite (see chart here) closed up over 15% and the small-cap Russell 2000 (see chart here) posted a whopping 22% gain in the month of April. Let’s not forget we are still off of the all time highs set earlier in the year but I don’t think anyone expected the magnitude of the rally that we just witnessed. There is no question that hopes of re-opening the economy and the latest advancements on therapeutic treatments and vaccines also played a role in the April rally.

Let’s look at it deeper than the just scientific advancements. The Federal Reserve actions and the recent stimulus packages issued by our government has also played a significant role in the eye-popping rally. With all of constant news flow and developments that comes out on Covid, I do think it is hard to realize how impactful the government stimulus packages and the new Federal Reserve stance is and what it does mean to the economy and markets now and going forward. I think it is fair to assume that once there is a definitive and stabilizing solution for the Covid crisis, that our economy and markets should have no problem taking off again. Until then, let’s all pray for a rapid solution to this ugly virus that has wreaked havoc on society. I do believe and have always believed in humanity and for science to lead the way.

Let’s take a quick look at the current technical shape of the the key indexes. We can all expect the markets to pull back after such a sharp bounce back rally. This is the case as I write my blog today. The markets are pulling back to their 20-day moving averages. Typically the 20-day, 50-day and especially the 200-day moving average acts as near term support levels. Let’s see if the current 20-day moving average holds as a near term support level as we head into the weekend.

Good luck to all 🙂

~George

A Stunning Comeback - Paula Mahfouz


New Week, New Record Highs?

New week, new record highs? The Dow Jones Industrial Average (see chart here) and the S&P 500 (see chart here) are fast approaching all-time highs. Both of these major indexes have been on a tear of late and could see new record highs this upcoming week. However, breaking news came out yesterday that Saudi Arabia has shut down half of its oil production after drones attacked the world’s largest oil processing facility. This attack will impact 5 million barrels of daily oil production. One sector that will certainly be affected is the energy space. The price of oil is now expected to skyrocket at least here in the short term. I am not sure if the markets will shrug this dynamic off, but I do expect energy stocks to outperform.

As I take a look at the Nasdaq Composite (see chart here) and the small-cap Russell 2000 (see chart here) both of these indexes appear to be ready to breakout and join the Dow Jones Industrials and the S&P 500 most recent performances. If the news out of the middle east has a negative impact on stocks, there are plenty of technical support levels that would come into play. All of the aforementioned key indexes are trading comfortably above their 20-day, 100-day and 200 day moving averages. During the month of August the 200-day moving average provided major support multiple times. As I look at the relative strength index to see how close we are to overbought conditions, there is still plenty of real estate before we see the 70 level of the RSI. So technically speaking the indexes appear to be in relatively good shape.

Without question the oil markets and the energy sector will be the focus this week. I am also curious to see how the overall markets react to this latest development out of the middle east. Good luck to all 🙂

~George


Now Mexico Too?

If it wasn’t enough to hit China harder, now Mexico too? Look by no means am I an expert on trade, tariffs or politics, but one thing I do know the stock market doesn’t like what has been going on with all three! The stock market also dislikes uncertainty and curve balls and this administration is certainly throwing a lot of both out there lately. Stocks have taken it on the chin with yet another wave of selling this week. For the first time since January the Dow Jones Industrial Average (see chart here) has fallen below the 25,000 mark. The S&P 500 (see chart here) closed in the 2,750 zone, the Nasdaq Composite (see chart here) closed near the 7,450 level and the small-cap Russell 2000 (see chart below) closed at 1,465.

What’s more eye catching to me is that all of the major averages have now fallen below their respective 200-day moving averages. Let’s do take a look at the technical shape of the market to see how much damage has been done. Now that the 200-day moving averages have been breached lets look at the RSI of each index. The relative strength index is a technical indicator that expresses whether or not a stock or index is overbought or oversold (click here for RSI). The Dow Jones Industrials (chart), the S&P 500 (chart), the Nasdaq Composite (chart) and the small-cap Russell 2000 (chart) all are racing toward the oversold level of 30. In fact, the Dow Jones breached the 30 level of the RSI yesterday.

Historically when stocks or indexes break their key support levels and head down towards the 30 level of the RSI, there is usually a continuation through that metric as well. That said, history does not always repeat itself but I would also not be surprised to see more selling pressure in the near future. Good luck to all 🙂

~George

Russell 2000 - Paula Mahfouz


Finally A Market Selloff!

In my last blog, I eluded to a market selloff that just did not happen and I was referring to how stocks typically behave in the August and September. Instead of markets selling off at the end of summer, stocks were setting records. Well the bears got what they had been anticipating over the summer and that is an eye-popping market drop last week. Over the course of two days the Dow Jones Industrial Average (chart) fell over 1300 points. Of course the S&P 500 (chart), the Nasdaq Composite (chart) and the small-cap Russell 2000 (chart) all fell in harmony as well. What’s more these bellwether indexes all breached their 200-day moving averages for the first time in months with the Dow Jones Industrial Average (chart) recapturing and closing above its 200-day on Friday, the Nasdaq Composite (chart) just closed shy of its 200-day, the S&P 500 (chart) literally closed right at its 200-day however, the small-cap Russell 2000 (chart) closed out last week meaningfully below its 200-day moving average looking to find some sort of support. The 200-day moving average is widely regarding by market technicians and institutional investors as a key metric of support and or resistance.

What does all this mean? First, a market that constantly goes up with no retracement to speak of can never be healthy long term. There must be backing and filling along the way so that the risk of a sudden and potentially drastic drop doesn’t occur as what we witnessed last week. I mean c’mon going up in the way that we have over the past decade is not only unheard of but the risk that can come forward from this can spark a nasty correction. I am not suggesting that this will be the case but for the first time since earlier in the year, investors and traders felt the selloff last week.

Earnings reporting season kicks in this week with hundreds of companies set to report. Let’s see if corporate earnings can buoy the market here during this long anticipated selloff. Good luck to all 🙂

George

A Market Selloff That Just Did Not Happen…

As summer ended where was the market selloff? Instead of conforming to what historically are the weaker months of the year whereas stocks at the very least should of paused with lighter volumes, the major averages hit all time highs. The Dow Jones Industrial Average (chart), the S&P 500 (chart), the Nasdaq Composite (chart), the small-cap Russell 2000 (chart) and even the Dow Jones Transportation Average (see chart below) all hit record highs in the third quarter. In fact the broad based S&P 500 (chart) turned in its best quarterly performance in five years. In my previous blog, I spoke to how traders and investors alike are awaiting a September selloff but seemingly nothing can stop this perma-bull market! Not trade wars, not interest rates, not the threat of inflation, not the daily chaos out of Washington, not historic seasonality, I mean nothing has stopped this bull market. Without a doubt this has been a close your eyes and a “go long” market. If you just did that over the past decade, you would of been part of 100% plus gains and whoever did do that, congratulations!

So now begs the question of what now? What now is fourth quarter earnings reporting season and oh yes the mid-term elections! October will not only be loaded with corporate earnings reports but there is also this little event call mid-term elections. I think it is safe to say that at the very least volatility should  rear its head up. As the summer trading months were unfolding vol went back to its “low vol” standard as we have witnessed for past decade. There is just no fear in the markets. The volatility index aka the VIX (chart) is a measure of investor fear and in this case, lack thereof. I have got to believe that volatility will increase as we head into earnings reporting season and especially as we approach mid-term elections. Good luck to all! 🙂

~George

Dow Jones Transports - George Mahfouz Jr

Are Energy Stocks And Banks Cracking?

As technology stocks continue to tick up to new record highs, banks and even more so energy stocks are showing signs of weakness. Yesterday, the Nasdaq (chart) hit an all time high of 6221.99 and the S&P 500 (chart) also notched a record recently at 2418.71. That said, the energy sector has lost almost 10 percent in the last month or so and the banking sector is beginning to technically breakdown. A very noticeable divergence is happening here and I think it is time to pay attention to this recent dynamic. The Dow Jones Industrial Average (chart) remains above 21000 and the small-cap Russell 2000 (chart) is seeking direction.

I am not surprised that certain sectors of the market are showing weakness which is only normal with the tremendous run the markets have had since the election, however, it is the sectors that are breaking down that is a bit alarming to me. One has to ask is the price action in oil and energy stocks indicative of weakening demand hence a weakening economy? Or is this just a matter of too much supply in oil regardless of the O.P.E.C. commitment to its production cuts. As far as the banks are concerned, one would also think with the Federal Reserve raising interest rates at their upcoming meeting in June and committing to additional rate hikes this year. that this would be bullish for bank stocks. Not the case recently. I am a little perplexed to the way the tape has been acting as of late especially pertaining to the aforementioned sectors.

The technical shape of the key indices appear to be intact with the exception of the small-cap Russell 2000. The Dow Jones Industrial Average (chart) is trading well above its 50-day moving average, along with the S&P 500 (chart)  trading near all-time highs and the Nasdaq (chart) as mentioned above hit an all-time high yesterday. However, the small-cap Russell 2000 (chart) is trading below its 50-day moving average and has been challenging certain support zones lately. This is yet another potential alarm along with the energy and banking sector weakness lately. So I would not be surprised to see the selling pressure in these particular sectors continue in the month of June which is historically one of the weakest month of the year for stocks. Good luck to all 🙂

~George