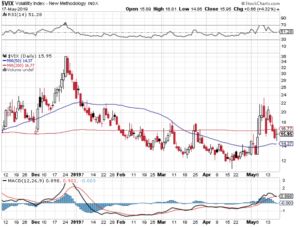
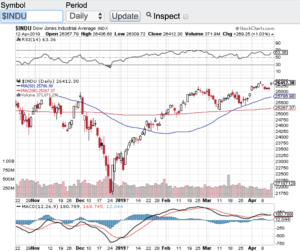
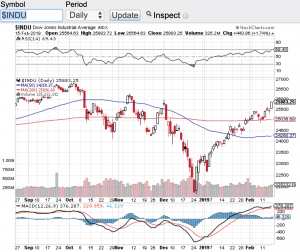
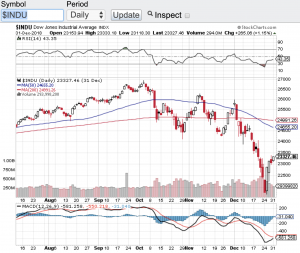
No question the T-word has done it again aka tariffs. The week started off with China’s retaliation to the Trump tariffs with a market sell-off on Monday sending the Dow Jones Industrial Average (see chart here) down 600 points. The trade war also sent volatility soaring earlier in the week as well $VIX (see chart below). This after the market set all-time highs. No matter what the case is, stocks will continue to sell-off on any negative tariff news. Why not? Tariffs can essentially act as a tax on American businesses and the consumer at least in the short term. Without question the tariff tape bombs have hit the market and had nearly doubled the price of vol over the past week or so. (see chart here)
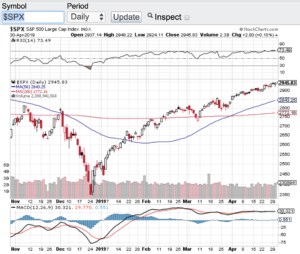
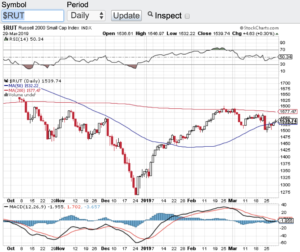
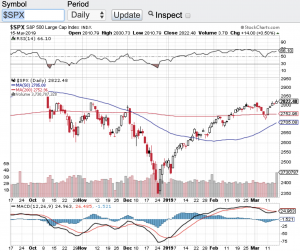
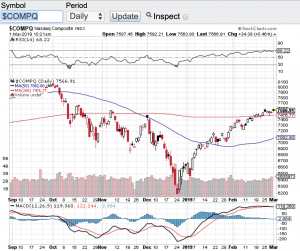
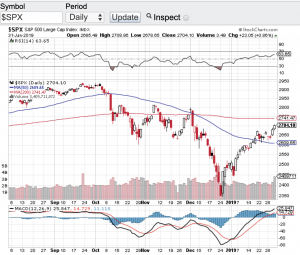
Now that the wild market swings are back, what’s next? Whenever I see a pick up in vol I take a closer look at the technical shape of the key indexes. Let’s start with the Dow Jones Industrial Average (see chart here). Since volatility kicked back in the Dow Jones Industrial Average lost around 1000 points, but found support at its 100 and 200-day moving averages and bounced off of those key support levels. The S&P 500 (chart) also sold off sharply over the past week or so but it too bounced off of key support zones. The Nasdaq Composite (chart) sold off almost identical to the S&P and bounced back nicely. Last but not least, the small-cap Russell 2000 (chart) actually fell through its 200-day moving average and found support at its 100-day. So technically speaking and if you are in the bull camp this is a very good sign for the continuation of the latest upward trend in the market. I am always a fan of pullbacks that meet support, holds that support and resumes its uptrend and that’s what we seemingly have now.
Let’s see if we get any positive developments on the trade war to calm the markets down a bit. Good luck to all 🙂
~George