Same Old, Same Old…

It’s the same old, same old for the stock market. New record highs were set today on the S&P 500 (see chart here) and the Nasdaq Composite (see chart here)! Wait a minute, didn’t the government partially shutdown earlier this week? And yet the markets are still hitting all-time highs! Well hopefully the gov. figures this out as quickly as possible so that what is shut down can reopen. As the S&P 500 and the Nasdaq hit all-time highs today, both the Dow Jones Industrial Average (see chart here) and the small-cap Russell 2000 (see chart here) are within striking distance of their respective all-times highs as well.

So, what in the world is going on with our markets? For starters, corporate earnings for the most part have exceeded expectations up to this point despite the swath of tariffs that have been imposed this year. Secondly, the Federal Reserve cut interest rates last month and have signaled they are prepared to reduce rates further if needed. From the looks of things, lower rates are becoming more obvious as the job market continues to struggle. Normally, I would be concerned of how frothy the markets look and there are pockets of the market that are frothy. However, if corporate America continues to deliver better than expected earnings, coupled with a more accommodative Federal Reserve, the chances of stocks going higher into year-end is a strong possibility. I am not suggesting this will be the case, but I am beyond impressed with how resilient the stock market continues to be.

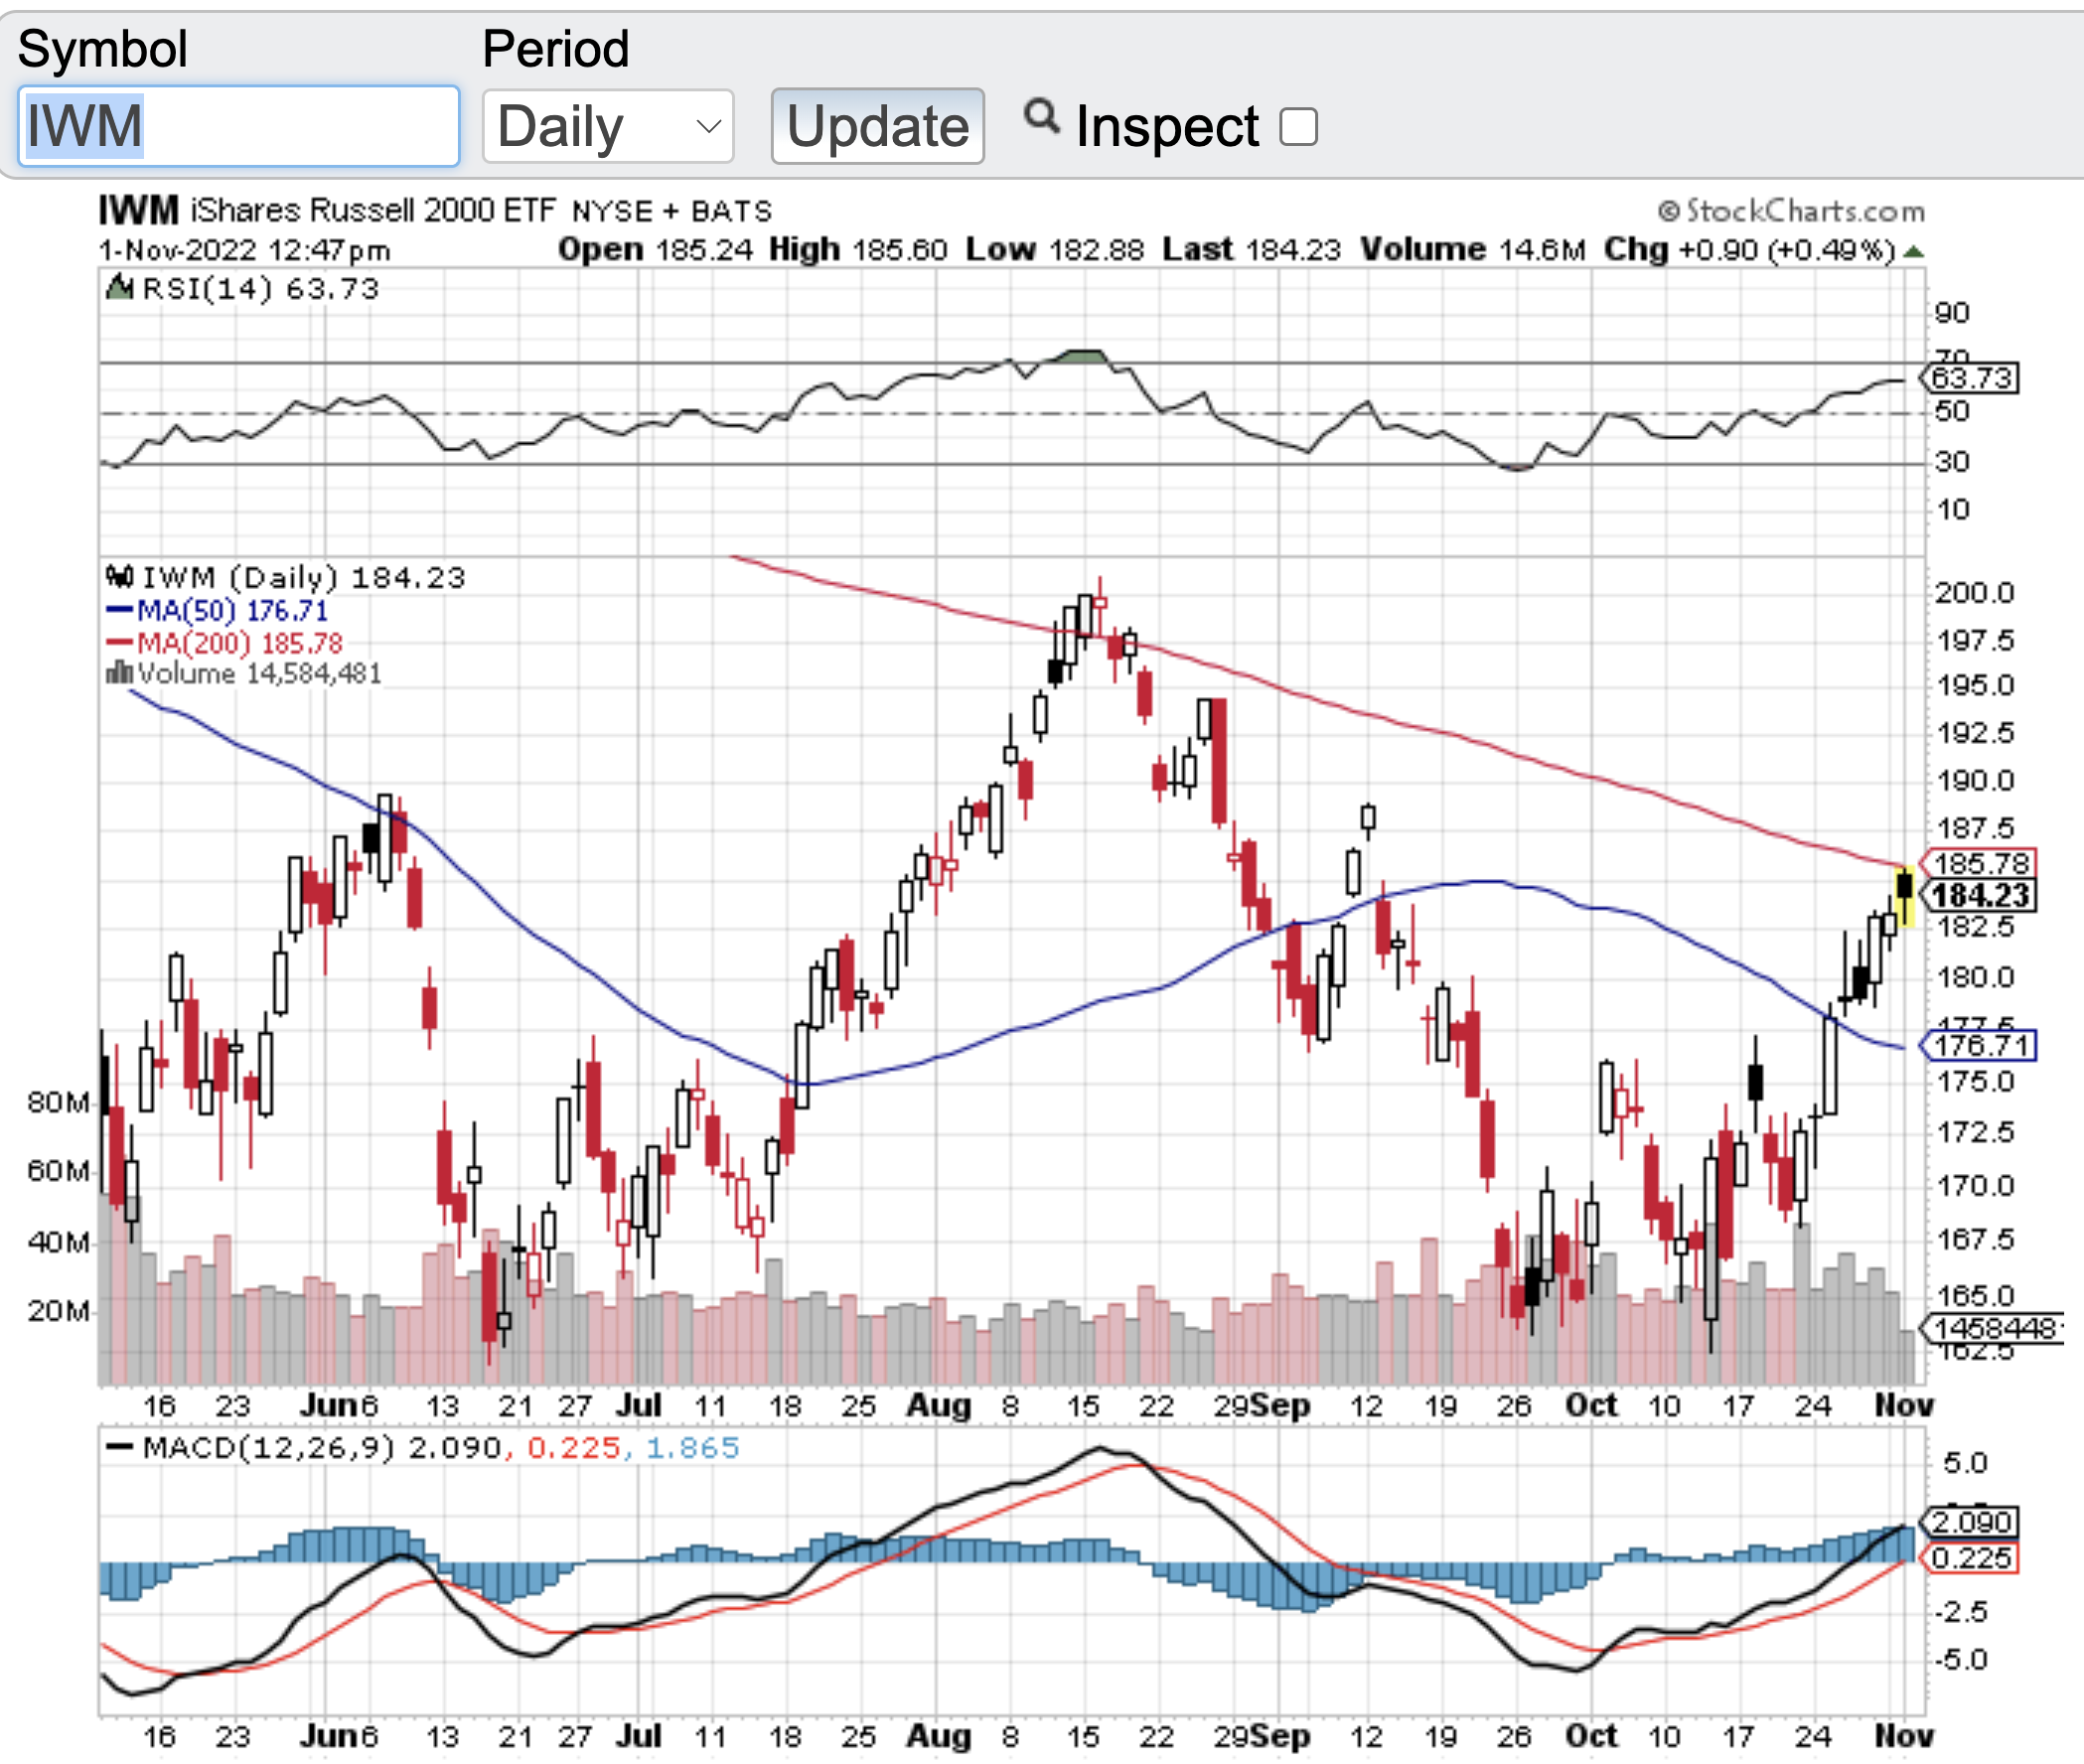
As I look at the technical shape of the key indexes the Dow Jones Industrial Average (see chart here) and the Russell 2000 (see chart here) are comfortably trading above their 20-day, 50-day and 200 day moving averages. Furthermore, both indexes are below the 70 value level of the Relative Strength Index aka the RSI. The 70-value level of the RSI is considered entering overbought territory. So, it appears that these two indices have room to run. A bit of a different story with the S&P 500 (see chart here) and the Nasdaq Composite (see chart here) whereas today both have tapped the 70 value level of the RSI. Please note that with the RSI Β it is not uncommon for stocks or indexes to go past the initial overbought level of 70 and proceed to as high as 80 and in some instances the 90 value level of the RSI. An 80 and especially a 90 value level is viewed as extremely overbought according the RSI principles. No matter what the case is, this bull market seemingly is not tired yet.

Good luck to all πŸ™‚

~George

All Key Support Levels Being Tested…

As the first quarter of the year came to a close, all of the major averages key support levels are being tested. The Dow Jones Industrial Average (see chart here), the S&P 500 (see chart here), the Nasdaq Composite (see chart here), and the small-cap Russell 2000 (see chart here and below) have all experienced selling pressure for the better part of the year. Ever since the new administration has taken office, the stock market has been selling off to the point of the 200-day moving averages of the aforementioned indexes have all been breached. It’s no secret that the constant flow of tariff news coming out of Washington is one of the main reasons why stocks are selling off. Markets do not like surprises and/or uncertainty and we have had more than enough lately.

As mentioned above, not only are the major averages support lines being tested, all of them have breached their 200-day moving averages which historically is a major support and/or resistance line. Please note, key support lines such as the 200-day M/A can indeed be breached and that doesn’t necessarily mean the end of the world. Major support lines can break temporarily before a reversal ensues. I am not suggesting this will occur, what I am saying is that just because a support line has been breached, it does not mean it’s a permanent situation.

What any market participant looks for and asks in market environments such as the one we are in now is; “when will the selling pressure stop?” Frankly what I am looking for is an end to the daily tape bombs on tariffs, the economy, consumer confidence etc. Things should begin to calm down once the markets understand how, why and when these dramatic policy changes will provide more benefits than drawbacks. We are going to need time to see how these tariffs will play out or just maybe our government will start changing its tune.Β  Good luck to all πŸ™‚

~George


The Technicals Are In Play…

As the markets try to find their footing, the technicals are surely in play. After a record-breaking performance over the past few months, the major averages are flirting with breaking down. The Dow Jones Industrial Average (see chart here) recently broke down below its 20 and 100 day moving average, as did the small-cap Russell 2000 (see chart here). Both the S&P 500 (see chart here) and the Nasdaq Composite (see chart here) have broken down through their 20 day moving averages, however, these indices are finding support at their 100-day M/A.

The recent market action to me is no surprise. As I alluded to in my previous blogs, month over month stocks and the major averages have been setting all-time highs. At some point in time a pause and reversal in stocks is to be expected. That time appears to be here and now. Of course, there are other factors weighing in on the markets recent pullback with the spotlight coming back on to the inflationary backdrop our economy has faced. Inflation has dropped dramatically over the past year, however, recently there has been an uptick in key sectors, click here for a recent report on the consumer price index. Now pundits are tying the most recent consumer price index into a narrative that the Federal Reserve may not be cutting interest rates after all. Some economists are even suggesting the Fed may even hike rates should inflation continue to uptick.

I come from the camp that a bump in the road with a slight uptick on inflation is nothing to panic over. Now if over the next couple of months the CPI continues to rise, then this would be a different discussion. In the near term if the major averages are able to hold here at the key support zones, then the recent pullback should find some footing. If the selling pressure continues then the 200-day moving average could be the next stop.

Good luck to all πŸ™‚

~George

Soft Month For Stocks…

August was a soft month for stocks across the board. The Dow Jones Industrial Average (see chart here) closed the month of August down 2.4%, the S&P 500 (see chart here) fell a modest 1.8%, the Nasdaq Composite (see chart here) gave up 2.2% and the small-cap Russell 2000 (see chart here) fell by over 5%. All things considered, not too shabby considering August historically is one of the weakest months of the year for stocks.

The market performance in August did snap a 5-month winning streak for the S&P 500 and the overall volatility in the stocks also picked up some steam. However, I do think the bulls will take such a modest pullback considering how strong the markets had been since early June. It appears some profit taking occurred in August while overall trading volumes were relatively lower. Now that summer is almost behind us, I expect trading volumes to increase along with the possibility of bigger market swings as we head into fall.

Now that we are in September the question becomes can the market weakness in August turn around in September? I typically look for catalysts to see if market direction will turn and as we head into September overall bullish sentiment has decreased. As contrary as this may sound, bullish sentiment decreasing is usually a bullish sign for the markets. I don’t like participating in markets where the sentiment is overly bullish and this has been the case all summer long, especially with how AI stocks went on a tear over the summer. The Artificial Intelligence sector lifted most indexes and if it wasn’t for the AI craze we have witnessed, I am not so sure if the markets would have enjoyed a multi-month bull run.

I always like to look at the technical shape of the markets as another potential catalyst for market moves. There is nothing really standing out either bullish or bearish. From the relative strength index aka the RSI, to where the moving averages are currently positioned, there is nothing too glaring one way or the other. Not a surprise considering how low the trading volumes were in August and the modest pullback that did occur.

Good luck to all πŸ™‚

~George

Is A Soft Landing Ahead?

For months now stock market pundits have been calling for a recession. Now it appears that a soft landing is ahead. You name it from Wall Street analysts to the media, not a day goes by without hearing the word recession. Well folks the economic data that has been coming out lately is showing just how strong ourΒ  economy remains. The latest gross domestic product (GDP) report Β that was issued last week showed that in the second quarter of this year our economy grew by 2.4% which surprised the street. What’s more is that this the fourth straight quarter of economic expansion. This sure doesn’t sound like a recession to me. Our economy is growing despite the Federal Reserve continuing to raise interest rates. As of now it sure does look like the Federal Reserve is managing these rate hikes to perfection.

The stock market sure likes what it is seeing from the economy. The Dow Jones Industrial Average (see chart here) continues to remain above its recent breakout. The same can be said for the S&P 500 (see chart here), the Nasdaq Composite (see chart here) and the small-cap Russell 2000 (see chart here). As I alluded to in my July blog, it appeared that stocks were on the verge of breaking out. Sure enough, the month of July was a very bullish month not only on the economic front but also for the stock market. One thing I now want to look for now is if stocks are becoming overbought?

As I look at some of the key technical indicators such as the RSI and the Moving Averages technical indicators nothing too alarming there from a technical standpoint. The exception here is both the Dow Jones Industrials (see chart here) and the S&P 500 (see chart here) are flirting with becoming overbought based on the relative strength index aka the RSI. That said, this is no surprise due to how strong the markets performed in month of July. Let’s see if there is a pullback of some sorts here in August or the continuation of this bullish action.

Wishing everyone the best of luck πŸ™‚

~George

Have We Bottomed Yet?

The million-dollar question that is populating the airwaves right now is “have we bottomed yet”? I think the answer lies in two things, first and foremost, the Federal Reserve and whether they will pull back some on their interest rate hikes. And the second question that comes to mind is how corporate earnings perform as this year continues to unfold. Well, the bull case is inflation will continue to ease which should slow down the Fed’s interest rate hikes. The bear case is inflation is still high and that it is going to take time for 2% inflation which is the Federal Reserve’s target. Needless to say, volatility should be in play for the foreseeable future.

The markets did close out the month of January on a high note. Yesterday, the Dow Jones Industrial Average (see chart here) closed up 368 points closing over the 34000 level. The S&P 500 (see chart here) finished the month of January up 59 points, the Nasdaq Composite (see chart here) closed up 190 points and the small-cap Russell 2000 (see chart here) closed up 46 points on the last day of January.

Technically speaking these key indexes also appear ready to run some more. Each of these key indexes are finding support at their respective 20-day, 50-day, 100-day and 200-day moving averages. As I look at the relative strength index aka the RSI, there is yet another technical indicator thatΒ  appears to favor stocks for a continuation to the upside. After a slight retracement of the RSI there are no overbought conditions yet as defined by the RSI.

All in all, I think the stock market is performing quite well considering the headwinds that are currently present. From high inflation to corporate earnings compression, to the ongoing geopolitical backdrop, I think the bulls will take the markets performance so far this year. And as mentioned above, I would not be surprised to see volatility in stocks for the foreseeable future.

Good luck to all πŸ™‚

~George

Best Monthly Performance In Decades!

We just witnessed the best monthly performance for stocks in the Dow in decades. The Dow Jones Industrial Average (see chart here) closed the month of October up almost 14%. The S&P 500 (see chart here) finished the month up 8% while the Nasdaq Composite (see chart here) rose 4% and the small-cap Russell 2000 (see chart here and below) closed the month of October out up over 10%. Quite the performance considering how much pressure the markets have been under over the past several months. The one index that is standing out to me right now is the tech centric Nasdaq. Technology stocks remain under pressure as earnings reporting season for the tech sector has disappointed analysts and investors alike. Earnings out of Facebook, Amazon and Google underscores the pressures that the tech sector is currently facing. My feelings are that we are simply in the midst of coming out of an unsustainable bull market that got out of control and into a more balanced and fair valued market. By no means am I suggesting that the market is now at fair value, but it is certainly adjusting to more reasonable levels.

That being said, the Federal Reserve is not done with raising interest rates and inflation also remains at highs not seen in 40 years. Both factors may continue to put pressure on stocks. In fact, there are analysts coming out and projecting another meaningful leg down for the markets. Whatever the case may be, opportunities do present themselves in bear markets however, patience is also required and scaling in is always a good fundamental approach when entering stocks in this type of market environment.

From a technical analysis standpoint, I do see the aforementioned indexes approaching or at their respective 200 and 100-day moving averages could be a sign of pause in this powerful rally we just experienced or a continuation of the current rally.

Good luck to all πŸ™‚

~George


Technically Speaking…

The sell-off in the markets accelerated in the month of April and technically speaking it appears there could be more selling pressure ahead. On the year, the Dow Jones Industrial Average (see chart here) is down nearly 10 percent, the S&P 500 (see chart here) is off over 13%, the Nasdaq Composite (see chart here) is down over 21% and the small-cap Russell 2000 (see chart here ) year to date is down 17%.

I am not surprised of the market weakness due to all the factors at play right now. From the war in Ukraine, to the highest inflation rates we have seen in over 40 years, the ongoing Covid backdrop albeit this dynamic appears to be improving and finally, interest rates. The Federal Reserve now has woken up to the fact that this low interest rate environment that we have lived in for over a decade is over. Runaway inflation has now become a major concern for the Fed, and they are now being beyond vocal of their intentions. A 50-basis point increase appears to be the hike here in May and hikes throughout the year are in play. In my view, this is the top catalyst as to the sell-off but let’s keep things in perspective. Last year and previous years for that matter have been a boon for stocks and pretty much every other asset class out there. Record after record have been set for years on asset classes and this is simply not sustainable. A healthy correction is beyond needed and it seems like we are in that mode now!

Now let’s look at the technical shape of the aforementioned key indexes. The Dow Jones Industrial Average (see chart here), the S&P 500 (see chart here), the Nasdaq Composite (see chart here) and the Russell 2000 (see chart here) all closed the month of April out below their key moving averages. The 20-day, 50-day, 100 and 200-day have all been breached while the Relative Strength Index aka the RSI have not yet breached an “oversold” condition. The RSI is a technical “momentum indicator” that has two values of importance. The 70-value level for potential “overbought” conditions and the 30-value level and below is a level that is considered “oversold. All the above indexes are currently hovering around the 35 level. Please remember “technical indicators” are there as a guide and a tool when assessing the technical backdrop of any given stock or index and is not 100 percent perfect.

Good luck to all πŸ™‚

~George


Record After Record!

The U.S. stock market notched record after record in 2021! What a year for all asset classes from stocks, to real estate, to the crypto markets!

The Dow Jones Industrial Average (see chart here) finished 2021 up 18.7%. The S&P 500 (see chart here) closed the year out up a whopping 27%. The Nasdaq Composite (see chart here) closed up 21.5% and the small-cap Russell 2000 (see chart here) closed 2021 up 13.7%. How counterintuitive are these results as our country and the world for that matter continues to face and deal with Covid-19. Covid is now entering its 3rd year with the latest variant taking the world by storm. The omicron variant are causing infection rates to soar. However, scientists are hopeful that this variant could be the catalyst to ending this pandemic due to how less virulent this variant is at least to the fully vaccinated. It’s still early but the way omicron has now seemingly and abruptly reversed its course in South Africa, there is hope that this will be the case everywhere else.

Back to the markets. As we enter 2022 the big question and maybe the only question the markets have is how aggressive will the Federal Reserve be in hiking interest rates. No question in the new year interest rates will begin to head north. Inflation is soaring and impacting almost everything, which is part of the reason why we are seeing all-time highs across the board. This is not sustainable and with interest rates on the verge of increasing, stocks will face their first true test as the tightening rolls out. That said and because the pandemic is still wreaking havoc, I do not expect the Fed will be too aggressive out of the gate.

Let’s look at the technical shape of the aforementioned indexes. The Dow Jones Industrial Average (see chart here) is comfortably trading above its 100 and 200-day moving averages as is the S&P 500 (see chart here) and the Nasdaq Composite (see chart here). The small-cap Russell 2000 (see chart below) is trading at it 100 and 200 day MA so let’s see if these support lines hold for the Russell. The other technical indicator that I prefer is the relative strength index aka the RSI and none of the aforementioned indexes are in overbought territory according to the RSI. The 70 value level of the RSI is considered overbought and the 30 value level is considered oversold and each index is trading right around the middle of that range.

Happy New Year!

~George

Record After Record! - Paula Mahfouz


New Variant Spooks Markets…

A new Covid variant has spooked the markets enough to spike the VIX almost 50% (see chart here). The VIX aka the fear index took off on Friday after news out of South Africa that a new variant has emerged. The CBOE volatility index is a measure of price action in the S&P 500 options chain over the next 30 days. Investors and institutional investors alike pay attention to how investor sentiment is going at any point in time through the CBOE vol index. Historically when the markets are at work with no real headwinds or threats, the VIX in the 10-15 value range. Yesterday the VIX closed north of 27. No question over the past few days the VIX is revealing a bit of investor anxiety.

So now the question becomes is this a short-lived dynamic or is there more selling pressure in the offing? My feelings are this is a normal knee jerk reaction to yet another potential obstacle our economy and markets face. From what I have read we are weeks away to understanding the severity of this new variant or lack thereof. In the meantime, I think patience is key and to not act in haste. For all we know the vaccines could protect the population from this latest variant and if so, the markets could snap right back. However, if this becomes as severe and contagious as the Delta variant, then there is a strong chance the markets would continue to adjust accordingly.

Let’s look at the technical backdrop of the major averages starting with the Dow Jones Industrial Average (see chart here). The Dow sold off over 650 points yesterday to close just above its 200-day moving average. The S&P 500 (see chart here) closed lower by 88 points approaching its 100-day moving average. The Nasdaq Composite (see chart here) closed the month of November down 245 points while breaching its 20-day moving average. Last but not least, the small-cap Russell 2000 (see chart below) closed down sharply as well yesterday, however, technically the Russell broke its 100 and 200-day moving averages in a meaningful way which does not bode well for this particular index as we enter the last month of the year.

One final note, no matter what happens in the market here in the short term, please take care of yourselves and your loved ones. We are approaching the two-year mark of this pandemic and everyone should take this serious, put the politics and conspiracy theories away and come together once and for all.

Wishing everyone a safe and healthy holiday season πŸ™‚

~George

New Variant Spooks Markets - Paula Mahfouz