Traders And Investors Are Awaiting A September Selloff…

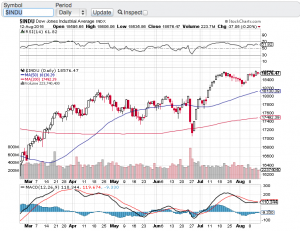
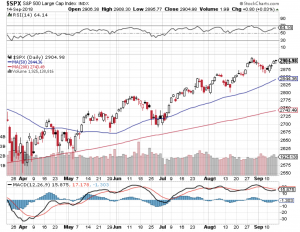
Traders and investors are awaiting a September selloff that actually may not come. Stocks continue to demonstrate strength and resiliency despite the political turmoil in Washington DC, rising interest rates and a seasonality headwind that just isn’t happening. August and September are typically weaker months for the stock market, instead the S&P 500 (see chart below), the Nasdaq Composite (chart) and the small-cap Russell 2000 (chart) hit all-time record highs and the end of August and despite a mini pullback shortly thereafter, the markets appear to have stabilized near all time highs. The Dow Jones Industrial Average (chart) did not make an all-time high in August, however, this index remains within striking distance of its all time high. The pundits are speaking to the strength of corporate America where earnings and profits are at their highest levels in decades as to the reason why the markets are not selling off. What is undeniable is that any time stocks have experienced a pull back it has been met with support from institutional investors and retail investors alike.

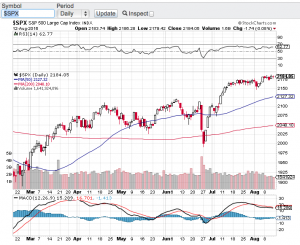
Speaking of support, let’s take a closer look at the technical shape of the aforementioned key indexes. Let’s start with the S&P 500 (chart). After pulling back to its 20-day moving average the S&P is right back at a breakout point. Next week we should see if the S&P can indeed breakout or fail and head back to its 20-day. The Nasdaq Composite index (chart) has similar chart pattern although it traded a bit below its 20-day support line for a few days before recapturing its 20-day and is now trading above it. A look at the Russell 2000 (chart), it too closed above its 20-day moving average and last but not least the Dow Jones Industrial Average (chart) also closed above its 20-day and this index is also right at a breakout or breakdown point. These bellwether indexes are also not in an extreme overbought condition according to the Relative Strength Index. The RSI tracks overbought or oversold conditions and is a momentum indicator that measures the degree and velocity of recent price changes to determine what is overbought and what may be oversold. We are simply not in any extreme condition according to the RSI principle.

Let’s see how the back half of September plays out and we will revisit the technical set-up of the markets in October. Good luck to all 🙂

~George
S&P 500 - George Mahfouz Jr


Bellwether Indexes Surge To All Time Highs!

Bellwether indexes surge to all time highs as the S&P 500 (chart) closed the month of August at 2901, the Nasdaq Composite (chart) closed at 8109, the small-cap Russell 2000 (chart) closed at 1740 and the Dow Jones Industrial Average (chart) is within striking distance of its all time high. I thought August is supposed to be a tough month for stocks? Not this year! New highs are happening while the political environment in our country is at a seemingly all-time low, the word impeachment surfaces daily now, tariffs are in the headlines daily, interest rates have been on the rise and now it seems that any type of progress made over the summer with North Korea may be in jeopardy. One would think that the aforementioned risks would be enough for an outright 10-20 percent market correction. Add in the seasonality factor and we should indeed be going red, not making all-time highs.

Now I am afraid to even mention that the month of September is historically the weakest month of the year for stocks right alongside with August. Do I dare say that September will be the month that our markets correct in a meaningful way? Do I have the courage to predict that this will be the month where the markets recognize and adjust for all of the risks that are present in our current environment? I don’t know people, I am as baffled as the next guy as to how these markets keep shrugging off real market issues. Oh by the way I forgot to mention we have mid-term elections forthcoming, the markets are not pricing in any risk there either. These markets are priced and acting like there is no absolute risks at all out there. Ok enough banter already!

How to play the markets now? I am a fan of the old adage “the trend is your friend” but folks I just can’t hop on this train at this point in time. I am heading to the sidelines until I see any type of technical breakdown to possibly consider implementing a short thesis or just wait for the inevitable pullback/sell-off to identify any potential long set-ups. Until then, Paula and I wish everyone a very safe and Happy Labor Day weekend 🙂

~George

Trading Between The Lines…

Trading between the lines is how this August is playing out so far. In what is supposed to be a seasonal volatile period, August seemingly has been playing right to the tune of this almost decade long bull market. The Dow Jones Industrial Average (chart), the S&P 500 (chart), the Nasdaq Composite (see chart) and the small-cap Russell 2000 (see chart below) to my surprise have all traded in a tight range this month. Furthermore, the 20-day moving average and even more so the 50-day moving average have played a major role in supporting the indexes whenever any selling does come in. Now we have had a couple days here in August where it looked like these support lines would be breached and in fact in some instances they were. However, whenever these support lines were touched or breached, buying came right in and placed a floor beneath the selling pressure.

I am not sure how the rest of the month will play out but August at least from a seasonality perspective still has the potential to demonstrate volatility and experience meaningful selling pressure. I really do believe that the bear camp expected to see August as their month, but from the looks of things the bears may have to wait until September or beyond. Corporate earnings for the most part have been topping expectations, the economy is seemingly firing on all cylinders and rising interest rates are not that big of a factor yet to be weighing heavily on stocks.

My plan for the rest of the month is simple. Pay attention to the support and resistance zones of the aforementioned indexes and for that matter any stock that I am considering to trade. Secondly, I need to see the trading volume pick up before any definitive trend can be trusted. The market volume just has not been here this month which is also typical of the dog days of summer. Patience is the keyword between now and month end. That said, I expect after the labor day holiday we will be having a much different conversation. Good luck to all 🙂

~George

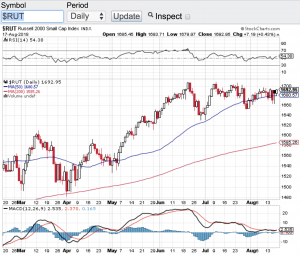
Russell 2000 - Paula Mahfouz

Strong Earnings Results Buoy Stocks!

Q1 strong earnings results buoy stocks! Corporate profits for this past quarter have exceeded expectations. On average corporate earnings growth surpassed 20 percent for the quarter however, it appears that the markets have priced in this impressive growth. For the most part stocks have had a muted response to their earnings results so far this year. The S&P 500 (chart) is barely up on the year. The Dow Jones Industrial Average (chart) finds itself essentially flat with the Nasdaq Composite modestly up (chart), however, the small-cap Russell 2000 (chart) quietly hit an all time high today. Interestingly enough when small-cap stocks are outperforming the other bellwether indexes, it’s usually a good sign for a rest of the market. We will have to see if history repeats itself here.

Yes the markets as a whole may not be up that much this year, but I am impressed with how the overall landscape has held up. The pending trade war with China, the on again and off again tensions with North Korea and rising interest rates have yet to really take hold of these markets in a negative manner. Yes we did experience a 10% sell-off in February but only to be met with support and a resumption of the upward bias towards stocks. That said, I do feel the markets are teetering on the potential of another pullback. Let’s take a look at the technical shape of the aforementioned indexes.

The Dow Jones Industrial Average (chart) closed just under its 100-day moving average at 24714, S&P 500 (chart) is on the other side of that coin closing just above its 100-day moving average at 2720, the Nasdaq Composite (chart) closed at 7382 and as previously mentioned, the small-cap Russell 2000 (chart) notched an all time high today breaking out of a triple top closing at 1625. So technically speaking these key indexes are not in any type of extreme condition either overbought or oversold and we will have to see how the balance of earnings reporting season plays out and whether or not we break out to the upside or have another retracement. Good luck to all 🙂

~George

Russell 2000 – All Time High!

So now the small-caps join in! The Russell 2000 (chart) closed the week at an all time record high of 1490. For most of the year the widely followed small-cap Russell 2000 has lagged the other major averages. Now it has broken out, see (chart). In fact, when you look at the chart of the Russell, one can say this index has gone parabolic. The Nasdaq (chart) and the S&P 500 (chart) also closed at their all time highs on Friday, while the Dow Jones Industrial Average (chart) posted yet another positive week. What’s more is the month of September is typically one of the weakest months of the year for equities losing on average of 1.5% happening 70% of the time since the 1970’s. Not this year, in fact there have been so many record-breaking closes on all of the aforementioned indices it’s hard to keep track.

Question is, now what? With the third quarter of the year now in the books, Q3 earnings reporting season is right around the corner. I have got to believe with the Federal Reserve closing the chapter on their quantitative easing policy and now taking those assets off of their books, plus interest rates scheduled to rise, investors should pay closer attention to the health and growth of corporate earnings. Do you remember the days when earnings and earnings growth actually mattered? Well those days may be back upon us. Hence, the report cards that come in from corporate America may actually move the markets in a fundamental way. This we have not seen in almost a decade. However, if the market momentum that we have experienced since the election continues, and investors ignore the fundamentals, then why couldn’t we end the year at even higher highs?

One thing for sure is October will be filled with many catalysts that should bring in some volatility and a lot of opportunity.  Between now and year end may be the time to implement a hedged strategy where one can potentially profit regardless of how the indexes or individual stocks react to what’s ahead. I’ll cover this in my next blog. Good luck to all. 🙂

~George

Where Is The Vol?

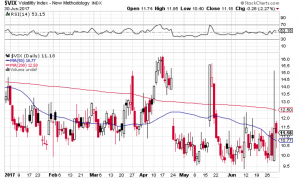
As the second quarter came to a close yesterday volatility is no where to be found. The CBOE Market Volatility Index also referred to as the VIX has been pretty much dormant this entire year (chart). Typically vol ticks up as we approach summer for a variety of reasons such as earnings reporting season, seasonality and of course the Federal Reserve policy actions. As expected the Fed did raise rates in June but the markets appear to be pricing in a higher interest rate environment. So far this year the Dow Jones Industrial Average (chart) is up 8.03%, the S&P 500 (chart) is up 8.24%, the Nasdaq Composite (chart) is up a whopping 14% and the small-cap Russell 2000 (chart) is up a modest 4.29%.

Seemingly everyday stocks are in melt-up mode. There are days where volatility tries to rear its head up, but that does not last very long. (See chart below). Even when Goldman Sachs came out with a bearish report on June 9th comparing the red-hot tech sector to the internet bubble era, the negative effect of that report lasted only a couple of days before tech found support and then proceeded to make new highs. The traders and investors that are waiting for the proverbial 10% or more correction are just not getting it. Buying the pullbacks is what has been working ever since the election but the problem is that if you are not stepping in on the 1-3% percent retracements, you are missing the next leg up. How much longer can this type of market environment last? Now that Q2 is in the books, earnings reporting season will soon begin. Let’s see if corporate earnings continue to come in stronger than analyst expectations and if so, stocks may just continue to remain bulletproof.

A quick gander at the technical shape of the aforementioned indexes and there are no signs of overbought or oversold conditions according the relative strength index. Therefore I am expecting vol to remain relatively low until at least second quarter earnings season begins. Good luck to all!

Both Paula and I wish everyone a very safe and happy Fourth of July holiday weekend 🙂

~George

VIX Chart - Paula Mahfouz

What August Swoon?

Actually quite the contrary! In fact new all time highs occurred this past week with the S&P 500 (see chart below), the Dow Jones Industrial Average (see chart below) and the Nasdaq (chart, click here). What’s more is these record closing highs of the aforementioned indexes occurred on the same day last week, a feat that has not happened since the bubble of 2000. Now I am not suggesting we are in a bubble like we were in dot-com days. Back then valuations of dot-com stocks and most of technology were rather insane. That said, the current price to earnings ratio of the S&P 500 is in the 20’s which is historically high. That alone could be a catalyst for a pause and consolidation and/or a pullback from the record high territory we have been trading in.

I am almost frightened to think or suggest that a retracement of any type is forthcoming simply due to the way the markets have been trading in a typically weak market season. As mentioned in my previous blog, August tends to be one of the weakest months of the year for the stock market. There is still a couple of weeks left in August and it is not too late to see historic trends surface. However, the way stocks have traded lately and with no real economic or geopolitical catalysts in the foreseeable future, this market melt-up may indeed continue.

Technically speaking, the trend lines of the 20-day, 50-day and 200-day moving averages all remain in tact and are yielding upward and the relative strength index of the key averages are not officially in overbought territory. So this is enough for me to not really expect much out of the market in either direction as we head into Labor Day weekend and as the summer winds down. Good luck to all 🙂

~George

S&P chart george mahfouz jr

dow jones chart george mahfouz jr

Now That’s What I Call A Bounce!

After such a torrid bull run in 2013, where the the four major averages gained over 25%, to no great surprise, these same indexes experienced more than a 5% pullback in January and early February. However, over the past couple of weeks and true to form, these indexes not only bounced off of key technical support zones, but they also took back their 50-day moving averages. For the week, the Dow Jones Industrial Average (chart) finished up 2.28%, the Nasdaq (chart) had a gain of 2.86%, the S&P 500 (chart) +2.32% and the small-cap Russell 2000 (chart) closed the week up 2.92%. The markets responded with a roar as the new Fed chairwomen Janet Yellen, in her first public appearance at the helm of the Fed, reiterated her commitment to model after the Bernanke era monetary policies. Stocks were already recovering from the January correction but accelerated their gains as she spoke to Congress this past Tuesday. All expectations now are that stocks will remain buoyed by the continuing asset backed purchases despite the modest tapering that is now in effect.

In my previous blog I expressed concern over the technical breakdown of the markets and that the 50-day moving averages of the key indices had been breached. Furthermore, I thought there was a possibility of the 200-day being the next stop. However, I did also indicate that if the markets were able to rebound and take back their 50-day and remain above that mark, that would be a positive. This is where we find ourselves now. All of the aforementioned key indexes have traded and closed above this key technical metric. The question now becomes whether or not this slingshot bounce and break above the 50-day is sustainable? Q4 earnings reporting season really didn’t say too much about the growth of corporate America, which overall was a mixed bag at best for the majority of the sectors. Couple this with economic signs of weakness as retail sales growth still remains flatlined, and I think we will continue to experience choppy waters for stocks, and I would be surprised if we began making new high after new high like last year. That said, liquidity for stocks is seemingly plentiful and we are still in a strong seasonality period for equities, so I also wouldn’t be surprised if we stabilized above the 50-day and consolidated for an extended period of time. Unless of course there is an unexpected negative geopolitical or global macro event that creeps back into the mix, then all bets are off. I will continue to track the technicals to gauge entry and exit points while using protective stops along the way. Good luck to all and both Paula and I wish everyone a very safe and happy Presidents’ Day holiday. Please note the markets are closed on Monday in recognition of Presidents’ Day.

Have a great weekend 🙂

~George

Pullback #1

I have been blogging for while now that a pullback at some point is inevitable and would even be healthy considering the parabolic move most of the key indexes and many stocks have had so far this year. However, there seemingly has not been a meaningful catalyst to trigger a noticeable pullback or better yet a healthy 10% correction, until maybe now? Taper talk is back on the table at the highest level since late May thanks to the continuing flow of recent positive economic data. In fact, some pundits predict that the Federal Reserve will begin reducing its asset purchases as early as this upcoming week. This chatter has been enough for the markets to take notice with the Dow Jones Industrial Average (chart) falling 264 points this week or 1.7%, the Nasdaq (chart) retreated by 1.5%, the S&P 500 (chart) gave back 1.6% and the small-cap Russell 2000 (chart) closed the week lower by 2.2%. Now let’s keep this into perspective, these benchmark indices on the year are still up a whopping 20%, 35.5%, 24.5% and 30% respectively.

What everyone has been accustom to for the past couple of years is that the protractive accommodative policies of the central banks from around the world would keep a floor under the markets, which most certainly has been the case. However, in late May of this year there had been widespread speculation that the Fed would indeed begin to reduce its bond buying and mortgage backed security purchases which sent the markets lower by over 5% by late June. The tapering fear at that point became unfounded as the economic data back then was still coming in too skittish in the Fed’s eyes.

Fast forward to today and there may now be enough positive economic data such as Q3 GDP coming in at 3.6%, the labor market showing signs of strength, personal spending rising and overall business confidence improving. These signs could be enough for the Fed to slowly reduce its asset purchases. So now the question on all minds is “how will stocks react once the Fed begins to taper?” This subject is currently being highly debated in most circles of the financial world and quite frankly no one knows. I suspect that the Fed will start to taper sooner than later but that they would be very conscious and conservative with their approach and how they signal their future actions. That said, once the central bank removes itself from the limelight and allow the markets to trade in a normal environment and on their own merits, I would expect volatility to get back to normal levels, hence, healthy pullbacks and even corrections should be back on the table. With this type of market environment, both long and short traders would be able to compose strategies based off of fundamentals and have the confidence to act accordingly.

Both Paula and I wish everyone a very safe, healthy and happy holiday season 🙂

~George