Is It Time For A Breather?

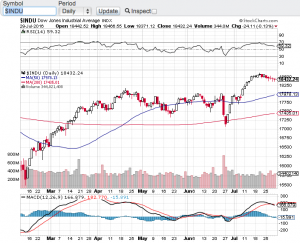
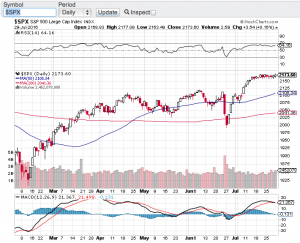
Stocks have been on a tear since the end of June with the key averages gaining close to 10% or more since coming off of their late June lows. That’s right double digit gains in a little over a month lead by the Nasdaq (chart) which is almost up 13%, followed by the small-cap Russell 2000 (chart) up 12.35% and both the S&P 500 (see chart below) and the Dow Jones Industrial Average (see chart below) closing up nearly 10% in that same time period. Part of the reason why the tech focused Nasdaq has led the charge is the stronger than expected and recently announced quarterly earnings results out of Amazon (NasdaqGS: AMZN) Apple (NasdaqGS: AAPL), Facebook (NasdaqGS: FB) and Google aka Alphabet (NasdaqGS: GOOGL).

So the question now is after such dramatic double digit gains in the aforementioned indices and in such a short period of time, is it time for a pause and/or a retracement? As you all know by now, the first thing that I look at when it comes to accelerated gains in any stock or index is the relative strength index also known as the RSI. The relative strength index is a technical indicator to determine overbought or oversold conditions, click here  for the complete definition. The RSI is also one of the favorite technical indicators used by market technicians, certain money managers and even select algorithms have the RSI programmed into their model. That said, the Nasdaq has now hit the 70 value level of the RSI which is an overbought level according to the RSI while the other key indices are not too far behind. Please note that indexes and stocks can remain overbought for extended periods of time.

So what does all of this mean? Well I think the set-up now is a little spooky. Not only are we at or approaching overbought conditions according to the relative strength index, but we now find ourselves in the month of August. August historically tends to be one of weakest month of the year for equities. In fact, over the past seven years the key indexes have fallen each year during this time period. History doesn’t always have to repeat itself, but the current set-up bodes well for a softer month ahead. We will see. Good luck to all 🙂

~George
S&P 500 George Mahfouz Jr

Dow Jones Chart George Mahfouz Jr

Nasdaq Closes At A Record High!

Tech stocks have taken off this week due to their strong earnings results. Companies such as Netflix (NasdaqGS: NFLX) soared 18% today after the company reported better than expected subscriber growth. Also today and just after the close, Google (NasdaqGS: GOOGL)  too reported better than expected results with revenue coming in at $14.35 billion compared to $14.26 billion the street was expecting. In after hours trading Google is up over 10% or well over $70.00 per share. Thanks to Google’s earnings results, most other tech companies are also trading up in the after-hours session so it appears that the rally on the Nasdaq (chart) will continue at least through tomorrow.

On a technical note, I want to point to your attention how two of the most influential major averages held their respective 200-day moving averages recently. A little over a week ago the markets were roiled in the Greece debt drama as well as how China’s stock market was falling off a cliff. There was enormous uncertainty as to how Greece and even more so how China’s stock market would play out. This fear and uncertainty sent the Dow Jones Industrial Average (chart) and the S&P 500 (chart)  tumbling down toward and below their 200-day moving averages. It really only took a day for this key support metric to kick in and demonstrate its technical support influence. Since this brief but noticeable selloff occurred, both indices have snapped back and we now find the S&P 500 (chart) within 10 points of its all-time high. Some pundits did indeed expect that Q2 earning reporting season could be the catalyst to lift the markets out of the fears of Greece and China. And seemingly their expectations have been met. That said, there are many more companies set to report their earnings results over the next couple of weeks, with all eyes now focusing on how Apple (NasdaqGS: AAPL) will fare as they are set to report their quarterly report next Tuesday July 21st after the close. As with most earnings reporting seasons over the past few years, stocks have overall fared well and this time it appears well enough to break key index records.

Good luck to all 🙂

~George

Are You Kidding Apple?

A $74.6 billion dollar quarter! Simply breathtaking! Apple also generated a record net profit of $18 billion, the highest quarterly net profit ever, for any company. Earnings reporting season is in high gear and no one so far have remotely come close to such an impressive performance. Congratulations Apple! That said, the overall market in the month of January did not fare as well. For the month, the Dow Jones Industrial Average (chart) lost 3.7%, the Nasdaq (chart) pulled back 2.1%, the S&P 500 (chart) retraced 3.1% and the small-cap Russell 2000 (chart) closed the month of January off 3.3%. Note that the majority of the monthly losses occurred in the past trading week. January also experienced a spike in volatility with the CBOE Market Volatility Index also known as the VIX (chart) closing just a tad under 21. The VIX is referred to as the “fear gauge” which shows the market’s expectation of upcoming volatility by calculating implied volatilities of both calls and puts of S&P 500 index options.

Technically speaking, the above key indices are fast approaching their respective 200-day moving averages, especially the Dow Jones Industrials (chart). Remember, the moving averages is amongst the most favorite technical indicator utilized by market technicians, computerized trading models and institutional investors alike. Furthermore, the relative strength index  of the aforementioned key indices are not in oversold conditions. The RSI is another favorite technical indicator of certain market technicians . So should the markets continue to experience an increase in volatility, the 200-day moving average should provide meaningful support as long as earnings reporting season closes out on a high note. I will monitor the technicals of the markets closely and wait to see how the balance of Q4 earnings reporting season plays out. If we test the 200-day moving averages and hold that level, and if earnings continue to come in positively, I would be then be inclined to become more bullish on equities. However, if we breakdown technically and if corporate America begins to show signs of slower growth, we will then be having a different discussion. Good luck to all!

Paula and I wish everyone a Happy Super Bowl Sunday 🙂

~George

A Mixed Bag…

At the height of Q4 earnings reporting season, results from corporate America have been conflicted, so far. Let’s start with everyone’s favorite, Apple (NasdaqGM: AAPL). Despite sales of its iPhone hitting records during the holiday season, those sales were shy of what the street was expecting by three million units. Furthermore, during the conference call after its earnings release on Monday, management projected a softer outlook for the upcoming quarter amid growing competition in the smartphone and tablet marketplace. This was enough to send Apple’s shares lower by over 10% this past week. In fact, the majority of the retailers have reported very disappointing results this earnings reporting season with the widely followed and traded retail SPDR S&P Retail ETF (NYSE Arca: XRT) (chart) down almost 10% for the month of January.

Now let’s take a look at the results of the four key indices so far this year. For the month of January, the Dow Jones Industrial Average (chart) is down 5.3%, the tech-heavy Nasdaq (chart) is off by 1.7%, the S&P 500 (chart) is lower by 3.6% and the small-cap Russell 2000 (chart) finished the month down by 2.8%. In my January 1st blog, I eluded to expecting a 5%, 10% or even a 15% correction in 2014, and we could very well be in this corrective phase as we speak. The question now to investors and traders alike is how steep could this current pullback become? Let’s not forget we are coming off of a year in which these key indexes individually gained well over 25%, with the Nasdaq leading the way gaining a whopping 38% in 2013. What I try to do is tune out all of the noise that comes out of the financial cable channels and media and focus on seasonal patterns and the technicals of the market. Technically speaking, the markets are not yet in an extreme oversold condition according to the RSI principles. Remember the Relative Strength Index a.k.a. the RSI is one of my favorite technical indicators where overbought and oversold conditions are exhibited depending on certain value levels. In this case and according to the RSI principle, the 30 value level and below is considered oversold and anything below 20 is considered extremely oversold. We are just not there yet. However, one thing I do want to highlight is for the first time in months the aforementioned key indices have all fallen and closed below their 50-day moving averages. Something that has not occurred since early October of last year and something we want to keep an eye on. If the markets cannot rise back and remain above their 50-day in the near future, the 200-day support line could be the next real support for these markets. I am not suggesting that we will test the 200-day moving average, but if this is the case, the selling pressure would most likely continue and may actually increase. Let’s see how next week’s earnings reports come in before we draw any further conclusions.

Looking ahead to next week, we will here earnings results from petroleum producer Anadarko (NYSE: APC), real estate investment trust Annaly Capital Management (NYSE: NLY), Yum Brands (NYSE: YUM), Boston Scientific Corp  (NYSE: BSX), retailer Michael Kors (NYSE: KORS), Cognizant Technology Solutions Corp (NasdaqGS: CTSH), Green Mountain Coffee Roasters (NasdaqGS: GMCR), Pandora Media (NYSE: P), AOL Inc. (NYSE: AOL), Expedia (NasdaqGS: EXPE), General Motors (NYSE: GM), Verisign Inc. (NasdaqGS: VRSN), Apollo Global Management (NYSE: APO), Flir Systems (NasdaqGS: FLIR) and Moody’s Corp (NYSE: MCO) just to name a few. So as earnings reporting season continues, so do the markets. Good luck to all.

Have a great weekend 🙂

~George

Nothing too spectacular, so far…

Earnings reporting season went into overdrive last week and quite honestly the markets were a lot quieter than I expected. For the week, the Dow Jones Industrial Average (chart) gained a modest 0.36%, the Nasdaq (chart) +0.58%, the S&P 500 (chart) +0.43% and the Russell 2000 (chart) actually pulled back 1.18%. So far earnings have come in rather tepid with a few exceptions. Also, volumes on the key indices have been relatively low which is playing a role in the lack of volatility. Technically speaking, nothing is standing out either. The major averages remain above their 50-day moving averages and also remain locked in their multi-week trading ranges.

Next week the financial world will be looking at Apple (NasdaqGS: AAPL) to see how their quarter fared. Apple has the ability to move the entire tech sector and the overall market for that matter, so I will certainly be keying into what the company reports financially, and what the tone is in their earnings conference call. Another highly anticipated earnings report next week will come from Facebook (NasdaqGS: FB). After a disastrous IPO, the street will be looking to see if the company has found its footing or if there is more downside to come. Let’s not forget about the other 750 companies that are reporting next week as we enter into the height of the Q2 earnings reporting season. Good luck to all.

Have a great weekend 🙂

~George