A Mixed Month For Stocks…

The month of May was a mixed month for stocks and the major averages. The Dow Jones Industrial Average closed out the month down 3.5% (see chart here) while the S&P 500 (see chart here) and the Nasdaq Composite closed the month out in the green. The small-cap Russell 2000 (see chart here) like the Dow closed the month out lower. Not bad considering how the debt ceiling issue and debate has been in the news seemingly hourly as everyone waits with bated breath as to what Congress will do. To me I wonder why this drama about raising the debt ceiling so the government can pay its debt and obligations is always a thing? Why even have a debt ceiling when there is no way United States of America could ever default on its debts and obligations. If this was to occur a global meltdown like never before seen could occur. How about this concept? No debt ceiling at all and instead vote in a fiscally responsible administration and politicians to manage our country’s finances properly. Sounds simple enough, but who am I kidding. Ok, enough of this and back to the markets.

Despite being an historically softer month for the stock market, May did not perform too bad as evidenced above. Yes, a mixed bag, but I think investors are happy to see that we didn’t fall off a cliff. That being said, as a look at the technical shape of the aforementioned indexes what is standing out to me is how key support lines are in play. The Dow Jones Industrial Average (chart) is hovering right around its 200-day moving average, while the S&P 500 (chart) is currently being supported by its 20-day moving average. The Nasdaq Composite (chart) is trading nicely above it’s 20, 50 and 200-day moving averages while the small-cap Russell 2000 (chart) is bouncing around its 20-day MA.

Lastly, I think the markets are in a position to continue its recent trading patterns and as soon as the final vote comes in on the debt ceiling matter, everyone will breathe a sigh of relief.

Good luck to all πŸ™‚

George

Rally Caps Are On!

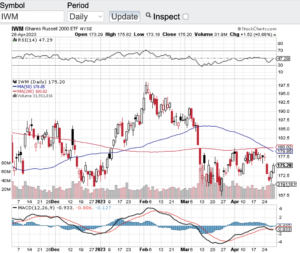
After breaching all moving average support lines including the 200-day, the major averages have their rally caps on! The Dow Jones Industrial Average (see chart here) finished the month of April on a high note. The same can be said for the S&P 500 (see chart here), the Nasdaq Composite (see chart here) and the small-cap Russell 2000 (see chart here and below).

After a slow start to the year including a brief dance with a bear market, stocks have rallied recently to turn green. Even the small-cap Russell 2000 is now green for 2023. So, what is causing the renewed bullish action? In part I think a stronger than expected first quarter earnings results have played a role in this latest bull run along with the Federal Reserve potentially slowing down their interest rate hike program. Positive earnings surprises have come from the health care sector, consumer discretionary and Industrials sector. It’s not just better than expected earnings results, it’s the top line revenue numbers that are also coming in stronger than expected. These data sets are great to see but we still do have some headwinds with inflation remaining high which means the Federal Reserve may not be quite done yet with higher rates.

When I take a look at the technical shape of the markets, there are some encouraging signs that may play a role in the continuation of this latest bull run. It appears that the Dow Jones Industrial Average (see chart here) is breakout out of a month’s long trading channel, as is the S&P 500 (see chart here) and the Nasdaq Composite (see chart here) also appears to be breaking out. I also see that the aforementioned indexes have not yet breached the 70 value level of the Relative Strength Index aka the RSI. The 70-value level of the RSI is considered the beginning of overbought conditions and we are not there yet.

Let’s see how the month of May goes and we will check back on the technical shape of the markets in June. Good luck to all πŸ™‚

~George

Rally Caps Are On! - Paula Mahfouz

The 200-Day Breached…

In my March blog I highlighted the 200-day moving average and questioned whether or not this key support zone would hold on the major averages. Low and behold the 200-day moving averages were breached for the better part of the month only to come roaring last week. The Dow Jones Industrial Average (see chart here) closed the month up slightly at 33274, the S&P 500 (see chart here) also closed in the green at 4109, the Nasdaq Composite (see chart here) closed the month up at 12221 points, however the small-cap Russell 2000 (see chart here) did not recapture its 200-day and closed the month of March lower at 1802.

As mentioned above, although the markets experienced heavy selling pressure last month which was fueled by the collapse of Silicon Valley Bank, in the final the week of March the markets experienced a meaningful rally which propelled most of the major averages right back through their respective 200-day. The response to this 200-day breach and how the major averages blew right past this technical line is seemingly bullish.

With the first quarter in the books market participants will now begin to focus on Q1 earnings reporting season to see how well corporate America is doing. Last month there was the shock of Silicon Valley Bank failing and that certainly drew the attention of the Federal Reserve. This event may guide the Fed going forward to change their current interest hike program. If the Fed starts easing interest rate hikes this could help the overall selling pressure that the markets have experienced so far this year. Furthermore, if Q1’s earning reporting season goes better than expected or at least if companies guide up a bit, this may be enough to quell the selling.

Let’s see what is in store for April and hopefully we continue to see the selling pressure ease up. Good luck to all πŸ™‚

~George

Have We Bottomed Yet?

The million-dollar question that is populating the airwaves right now is “have we bottomed yet”? I think the answer lies in two things, first and foremost, the Federal Reserve and whether they will pull back some on their interest rate hikes. And the second question that comes to mind is how corporate earnings perform as this year continues to unfold. Well, the bull case is inflation will continue to ease which should slow down the Fed’s interest rate hikes. The bear case is inflation is still high and that it is going to take time for 2% inflation which is the Federal Reserve’s target. Needless to say, volatility should be in play for the foreseeable future.

The markets did close out the month of January on a high note. Yesterday, the Dow Jones Industrial Average (see chart here) closed up 368 points closing over the 34000 level. The S&P 500 (see chart here) finished the month of January up 59 points, the Nasdaq Composite (see chart here) closed up 190 points and the small-cap Russell 2000 (see chart here) closed up 46 points on the last day of January.

Technically speaking these key indexes also appear ready to run some more. Each of these key indexes are finding support at their respective 20-day, 50-day, 100-day and 200-day moving averages. As I look at the relative strength index aka the RSI, there is yet another technical indicator thatΒ  appears to favor stocks for a continuation to the upside. After a slight retracement of the RSI there are no overbought conditions yet as defined by the RSI.

All in all, I think the stock market is performing quite well considering the headwinds that are currently present. From high inflation to corporate earnings compression, to the ongoing geopolitical backdrop, I think the bulls will take the markets performance so far this year. And as mentioned above, I would not be surprised to see volatility in stocks for the foreseeable future.

Good luck to all πŸ™‚

~George

Who’s Ready For The New Year?

After one of the weakest market performances since 2008, who is ready for the new year? I know I am!

Let’s take a look at how the major averages closed the year out. The Dow Jones Industrial Average (see chart here) finished lower by 8.78%, the S&P 500 (see chart here) shed almost 20%, the Nasdaq Composite (see chart here) fell a whopping 33% and the Russell 2000 (see chart here) closed the year down over 21%. Despite the bear market we now find ourselves in let’s not forget of how we got here. For the past 10 plus years and especially the past 3 years, central banks from around the world flooded the system with enormous liquidity. This liquidity came in many forms and with essentially charging little to no interest. The Federal Reserve Banks from around the globe started these programs when the 2008 financial crisis hit and for the better part of 15 years had not let up. What changed their position is how inflation took off this year to rates not seen in over 40 years.

Fast forward to today and we now have watched the Federal Reserve raise interest rates multiple times over the past several months and along with that taking the stock market with it. That said, I don’t blame the Fed for raising rates, in fact some pundits might argue as to why it took so long. Oh yea, a once in a century global pandemic shocked the world and the economy. So, what should have been a policy shift years ago became extended stimulus parade of liquidity into the system. Which by the way was very needed. Ok, so let’s not panic as to what occurred in the markets last year, from my vantage point this appears to be simply a function of interest rates and markets beginning to normalize.

Wishing everyone the healthiest, happiest, and most prosperous New Year πŸ™‚

Cheers,

~George


Trying To Make Up Its Mind!

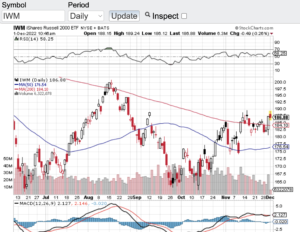
Seemingly, the markets are trying to make up their mind on whether to breakout or breakdown. Over the past couple weeks, the Dow Jones Industrial Average (see chart here), the S&P 500 (see chart here), the Nasdaq Composite (see chart here) and the small-cap Russell 2000 (see chart here and below) have all been consolidating in a very tight trading range. As you can see in the charts of these major averages, consolidation has occurred while also finding support at their 100 and 200-day moving averages. These tight trading ranges along with moving average support bodes well for an inevitable break from this current trading range . The question is will the markets breakout before year end or breakdown and through their respective moving averages support lines?

Let’s face it, we are currently in a bear market and rightfully so. It has been repulsive to see how inflated asset prices were during the heart of the pandemic. Stimulus was abound, interest rates remained at all-time lows and then speculation went from reasonable to very disturbing. This recipe set up the bear market and then Federal Reserve launched it by aggressively raising interest rates. My comment to that is what took them so long? The Fed had no choice to but to start raising rates and inflation took off to levels not seen in over 40 years. The silver lining to all the above is that finally we are moving towards a market that is now more trustworthy. Trustworthy from the standpoint that stocks may actually start trading at reasonable levels to where opportunities can be found. In fact, it is possible that certain stocks and sectors for that matter will overshoot to the downside to where great opportunities could come to the forefront.

As mentioned above, stocks are currently trading in a tight trading range and have support at their moving averages. However, with year-end approaching and as traders and investors reposition their portfolios I would not be surprised if we exit this tight trading range the markets have been in.

Good luck to all πŸ™‚

~George

Best Monthly Performance In Decades!

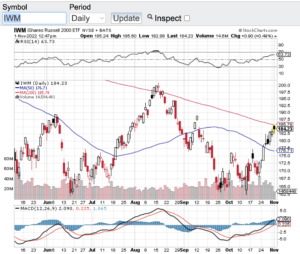
We just witnessed the best monthly performance for stocks in the Dow in decades. The Dow Jones Industrial Average (see chart here) closed the month of October up almost 14%. The S&P 500 (see chart here) finished the month up 8% while the Nasdaq Composite (see chart here) rose 4% and the small-cap Russell 2000 (see chart here and below) closed the month of October out up over 10%. Quite the performance considering how much pressure the markets have been under over the past several months. The one index that is standing out to me right now is the tech centric Nasdaq. Technology stocks remain under pressure as earnings reporting season for the tech sector has disappointed analysts and investors alike. Earnings out of Facebook, Amazon and Google underscores the pressures that the tech sector is currently facing. My feelings are that we are simply in the midst of coming out of an unsustainable bull market that got out of control and into a more balanced and fair valued market. By no means am I suggesting that the market is now at fair value, but it is certainly adjusting to more reasonable levels.

That being said, the Federal Reserve is not done with raising interest rates and inflation also remains at highs not seen in 40 years. Both factors may continue to put pressure on stocks. In fact, there are analysts coming out and projecting another meaningful leg down for the markets. Whatever the case may be, opportunities do present themselves in bear markets however, patience is also required and scaling in is always a good fundamental approach when entering stocks in this type of market environment.

From a technical analysis standpoint, I do see the aforementioned indexes approaching or at their respective 200 and 100-day moving averages could be a sign of pause in this powerful rally we just experienced or a continuation of the current rally.

Good luck to all πŸ™‚

~George


The Fed Versus Inflation…

The market environment we find ourselves in is a clear dynamic of the Federal Reserve taking on inflation. The question now is will the Federal Reserve overreach with its interest rate war on inflation? One thing I have learned as it pertains to the markets is not to go against the power of the Fed and to trust they will ultimately steer the ship right.

That being said, what a month to forget for stocks! In the month of September alone the Dow Jones Industrial Average (see chart here) lost almost 9%, the S&P 500 (see chart here) fell over 9% while the Nasdaq Composite (see chart here) and the small-cap Russell 2000 (see chart here) both gave up over 10% in September. I think we are all ready to turn the page on the markets summer performance. In fact, the year to date performance of the major averages are well into bear market territory.

In hindsight it was plain as day how unsustainable asset prices were across the board. From the stock market to the real estate market to the crazy land of cryptos. The excesses that the markets enjoyed while they were hot was a direct reflection of the Fed’s easy monetary policies. From essentially zero percent interest rates, to buying up treasuries and other asset classes to keep the economy strong during Covid, now the markets are paying that price. The head scratcher for me is how long it took the Fed to reverse its course but at least now we can begin to get to normalized rates which is a net positive for all markets.

As I look at the current technical shape of the aforementioned indexes, it’s not a pretty sight. The Dow Jones Industrial Average (see chart here), the S&P 500 (see chart here) and the Nasdaq Composite (see chart here) are at or below their 52-week lows with no technical support yet in sight. The small-cap Russell 2000 (see chart here) is near its 52-week low but does have a bit of support right here. I think we could continue to see some more selling pressure before it’s all said and done but if you are a long-term holder of equities these type of market conditions can create some great opportunities too.

Good luck to all πŸ™‚

~George

No Surprise Here…

It’s no surprise here that the month of August was weak for the overall stock market. Despite the current economic backdrop historically August tends to underperform compared to the rest of the year. The Dow Jones Industrial Average (see chart here) last month closed down over 1000 points and the S&P 500 (see chart here) closed below the 4000 mark. The Nasdaq Composite (see chart here) gave up over 500 points and the small-cap Russell 2000 (see chart here) pulled back slightly. That being said and considering the current headwinds we are facing I believe stocks held up pretty well.

Now that we are in September and from a seasonal perspective especially with mid-terms approaching, I anticipate volatility to continue. There is also a possibility that vol will accelerate. Looking at the current backdrop, we have a Federal Reserve that continues to raise interest rates, corporate earnings are stagnating and the political situation in our country is nothing to be proud of now. Taking all of these factors into consideration, plus the constant flow of negative news, August could off sold off a lot more. Out of all these dynamics I prefer to tune out most all of the noise and really study how the Federal Reserve is navigating itself through this cycle. To me it is this entity that swings the biggest bat on how the markets move. As you know by now, I also pay attention to the technical shape of the key indexes.

Speaking of the technical shape of the market, let’s take a look. The Dow Jones Industrial Average (see chart here) is trading below its 20 day, 100 and 200 day moving averages. The S&P 500 (see chart here) is also experiencing a technically weak pattern as is the Nasdaq Composite (see chart here) and the Russell 2000 (see chart here). Again, no surprise here but I did notice the markets today appeared to find some support. For the markets the dog days of summer are almost over, but I think we all need to buckle up between now and the mid-terms because I do expect volatility to continue.

Good luck to all and have a great and safe Labor Day Holiday!

~George

What A Month For Stocks!

What a month for stocks as the major averages rebounded sharply in July. After witnessing an incessant selloff over the past few months, July turned out to be the best month for stocks in years. After falling into bear market territory, the S&P 500 (see chart here) gained almost 10% last month cutting its year to date losses in dramatic fashion. As I look at the Dow Jones Industrial Average (see chart here) a thousand-point gain in the last week or so is not too shabby either. Last but not least, both the Nasdaq Composite (see chart here) and the small-cap Russell 2000 (see chart here) also has enjoyed a strong recovery from their recent lows.

So why was there such a strong performance in the month of July? Q2 earnings reporting season is in full swing and at best this Q2 earnings so far have been a mixed bag. The Fed last week also raised interest rates another 0.75%. Inflation remains at or near 40-year highs. So, if you solely look at these metrics one would think the recent selloff would be accelerating. Clearly this is not the case, yet! The bears would argue that this is an “oversold” bounce and part of me agrees with that. However, I think it is too early to say that we are back to a full-fledged bull market. I do think if the markets remain stable over the next couple of months this could be a sign of a bottoming process. Let’s see how the rest of the summer plays out.

Now let’s move over to the technical shape of the aforementioned indexes. What has caught my eye is how the major averages are either at or have recaptured their 100-day moving average. This important support and/or resistance line is key as to whether stocks will pause into the resistance that moving averages experience, or if the momentum continues, then this could mean that this latest bull run will continue.

Good luck to all πŸ™‚

~George