53 Record Highs And Counting…

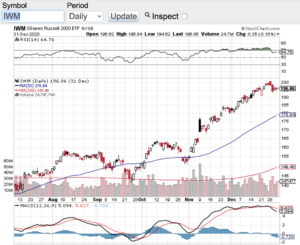
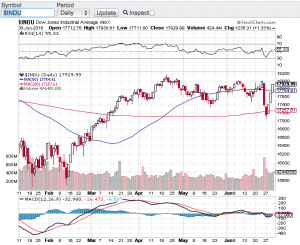
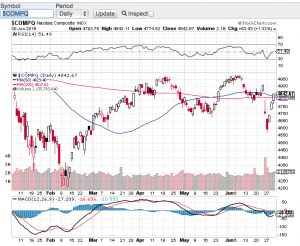
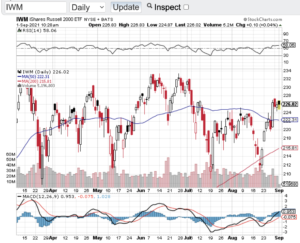
The S&P 500 (see chart here) has hit 53 record highs so far in 2021 and counting. That’s right folks 53 all-time highs this year alone. The Nasdaq Composite (see chart here) has logged 32 record highs in 2021 as well. The Dow Jones Industrial Average (see chart here) has also been on fire trading above the 35000 level and the small-cap Russell 2000 (see chart below) continues to perform alongside the aforementioned bellwether indexes. How much longer can this bull run? I think it began with the Federal Reserve and its longstanding monetary policies and now there seems to be a subtle change in the Fed’s position.

Last Friday at the Federal Reserve’s Jackson Hole Economic Symposium, Fed Reserve chairman Jerome Powell signaled again that the Fed would soon begin to pullback on its $120B per month bond asset purchases. This support to the markets and the economy along with a zero percent interest rate backdrop has been THE catalyst to support record high after record high in our stock market. Of course the massive economic stimulus packages that have been disseminated since the start of the pandemic has also played a role in consumer spending which has also propelled stocks to new heights.

Now we all know this cannot go on forever. Free money, zero percent interest rates, asset purchases and the like will end at some point in time. The question then becomes what happens to the stock market when all of this support winds down? Friends the answer is simple. Corporate America is going to have to produce on its own. Meaning this, for the continuation of this decade long bull market, companies will have to not only have to catch up with their current valuations they will have to exceed expectations going forward. This will certainly separate real growth companies from the rest of the pack and that’s when we just may see a more normal ebb and flow in our markets. Good luck to all 🙂 and have a safe and Happy Labor Day weekend.

~George
53 In a Row And Counting - Paula Mahfouz


2021 Is Here…

2021 is here and it could not of come fast enough. Happy New Year and I think we can all use a fresh start! The year 2020 was one of the most challenging years our country and the world has faced. One of the only exceptions that did not face many challenges is the stock market. Despite the global pandemic we remain in and the non-stop chaos out of Washington DC, the major averages set record highs throughout the year. Who would of thought that stocks and market speculation would be at such a fever pitch considering the backdrop of 2020. During this latest bull market surge one thing that stands out to me is how margin debt has hit all time highs. Investors have borrowed over $700 billion dollars against their portfolios which is also a new record. This is somewhat alarming because when the market experiences a correction, margin debt can accelerate any meaningful selloff. Some investors could be forced to sell if their margin debt becomes disproportionate to their overall account value. That said, when record highs continue to be set the risk of margin debt tends to be overlooked.

Speaking of record highs, both the Dow Jones Industrial Average (see chart here) and the S&P 500 (see chart here) set new records on the last trading day of the year. The Nasdaq Composite (see chart here) and the Russell 2000 (see chart below) also set records earlier in the week. Although stocks and indexes feel overbought, we are not seeing extreme overbought conditions according the the relative strength index also know as the RSI. There is also support in place at the 20-day, 50-day, 100 and 200-day moving averages. So technically speaking the key indices appear to be in good shape. This set-up bodes well for the continuation of the market rally that we are in.

Of course there are risks out there that could temper the record setting enthusiasm. One risk in particular is the upcoming runoff election in Georgia next week. If the democrats take control of the Senate, this could be viewed as a negative for stocks. The markets historically have liked when there is a split majority between the House and Senate. Pundits argue that a Democratic President and a Democrat controlled Congress could affect income and capital gains taxes that would negatively impact stocks. I am not sure if this will play out but nonetheless as we continue down this bull market path we should not be lullabied to sleep with the risks out there. Good luck to all 🙂

~George

2021 Is Here - Paula Mahfouz

An Absolutely Incredible Stock Market!

It is absolutely incredible that this stock market is weathering the threat of impeachment! We have witnessed the strongest bull market in history! Not even the threat of impeachment can rattle this market. I do not want to get too political here but if half of this is true the markets just don’t care. Then throw into the mix the constant flip flopping that is going on with the China trade war and we are still near all-time highs? This makes me believe more now than ever that passive investing has almost got a total grip on stocks. Seemingly NOTHING can shake these markets. It’s almost like close your eyes and hang on for the ride. This worries me a bit. Why? Well for starters stocks used to be valued by their proprietary nature, growth potential, earnings power and ultimate dividend yields. We have witnessed a melt up in the stock market for more than a decade despite the shocks that have come and gone. What’s more is the geopolitical risks that are here and present and now our own President is going through an impeachment process and we still are near all time highs? Simply an absolutely incredible stock market we find ourselves in!

Well there is an old saying on Wall Street and that is the “trend is your friend!” My friends there is no denying this over the past decade. Let’s also keep in mind that the market is a lot smarter than we think. Meaning, there is no panic with this latest tape bomb of impeachment. Well one can say there is no way this President will get impeached because the Senate will not roll over. This very well may be the case. One thing we can do is pay attention to how corporate America continues to perform or not perform. At some point in time one would think that valuations will matter and that the markets will begin to pay attention to the normal risks that are inherent with any market.

Good luck to all 🙂

~George


Best Start Of The Year In Decades!

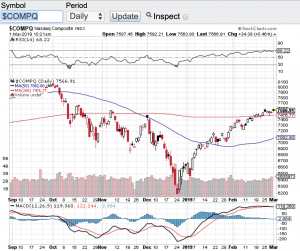
Stocks have opened the month of March rip roaring again adding to the best start of the year for the averages in decades. The Dow Jones Industrial Average (see chart here) opened the trading day up over 200 points, the S&P 500 (see chart here) opened up over 20 points, the Nasdaq Composite (see chart below) opened up over 55 points and the small-cap Russell 2000 (see chart here) opened up over 11 points. These gains are adding to the double digits percentage gains the markets have already realized in 2019.

So why such a strong start to the year? I am not trying to sound like a broken record but this 10 year long bull market is a head scratcher.  No matter what has been thrown at one of the longest bull markets in history, nothing seems have an adverse affect. You name the crises and stocks shrug it off. Whether it is a geopolitical event, the Federal Reserve raising rates or the daily chaos that comes out of Washington, nothing has disrupted this incessant rise in stocks. We did get a definitive correction late last year in where the bears came out of hibernation and predicted the end of the bull market and that a 40% correction is now imminent. Well don’t look now but we are not too far off from setting new all time highs in the aforementioned indexes.

Technically speaking it appears that the coast is clear for now as well. All of the major averages are now trading above their respective 20-day, 50-day and 200 day moving averages which is a very bullish sign. The one caveat to the technical shape of the market is that stocks are a bit overextended. Overbought conditions do exist technically and according to the relative strength index also known as the RSI. That said, the pullbacks that do occur continue to be met with support with buyers stepping in willing to add to their existing positions or open up new positions. The trend remains your friend in our current environment. Good luck to all 🙂

~George

Nasdaq Composite - Paula Mahfouz

The Economy Is Booming, But…

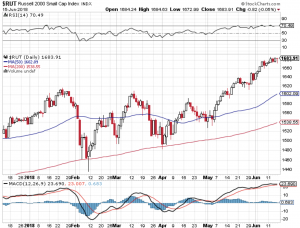
There is no question the economy is booming but what does this mean long term for stocks? When the economy is firing on all cylinders like it is now here in the United States one may think the stock market must be ready for its next leg up! Not so fast. Historically when the economy heats up and the unemployment rate becomes so low, that does not typically bode well for stocks. Why you ask? Simply put, the Federal Reserve does not want inflation to rear its head up and their main tool to avert inflationary pressures is to raise interest rates. As counterintuitive as it may seem, a strong economy and low unemployment may be the catalyst to put the brakes on this almost 10 year bull market run. That said, the major averages continue to show extraordinary resilience no matter what comes at it. The Dow Jones Industrial Average (chart) closed the week above 25,000, the S&P 500 (chart) finished the week at 2779, the Nasdaq Composite (chart), finished near its all time high and the small-cap Russell 2000 (see chart below) closed the week out a few points away from it’s all time high as well.

It is quite remarkable how the aforementioned indexes are behaving with all things considered. This past week the Federal Reserve raised interest rates again and signaled two more hikes this year and the trade war chatter and action with China and our own allies for that matter is accelerating. Just these two events alone show be putting selling pressure on stocks not setting new record highs as is the case this past week with the Nasdaq Composite (chart) and the Russell 2000 (chart). These indexes also remain well above key moving averages which at some point in time reversion to the mean should occur. I will be looking for opportunities on the short side but will continue to respect the fact that this years-long bull market remains intact at least from a technical standpoint. Good luck to all 🙂

~George

george mahfouz jr - Russell 2000


New Year, New Records?

Happy New Year! Will 2018 be a new year of new records? Nothing would surprise me. Especially as the Dow Jones Industrial Average (chart), the S&P 500 (chart), the Nasdaq (chart) and the small-cap Russell 2000 (chart) shattered record after record after record in 2017. In fact the Dow Jones Industrial Average set 70 record closing highs in 2017. That’s not a typo folks, 70 record closing highs. The other aforementioned key indices also set multiple record highs throughout last year. So could we see a repeat performance in 2018? I don’t know about another 70 record highs this year but I would not be surprised to see continuing strength in the markets in 2018. Yes the Federal Reserve is now in a rate hike mode which typically does not bode well for stocks, but this Fed and central banks from around the world understand the need to go about their new rate hike policies in a gradual manner. Raising rates too aggressively could be the exact catalyst to put the brakes on this almost decade long bull market. I don’t think this will be the case at least with our own Federal Reserve. Jerome Powell will be replacing Janet Yellen in early February as our new Federal Reserve Chairman. Mr. Powell who has been a member of the Federal Reserve’s board of governors since 2012 has voted for keeping interest rates at bay while the economy continues to recover.

Speaking of the economy, expansion continues to occur and we will soon find out how our economy is  trickling down into corporate America. Fourth quarter earnings reporting season will begin here in January and this could very well serve as a key catalyst for the continuation of the bull market. That said, I think most investors and traders are looking for the markets to pause and pullback from this historic run we continue to be on. It is truly breathtaking to witness the record pace that stocks have enjoyed for years now. Personally, I hope and some point in time we do get a meaningful pullback so we can have the opportunity to step in at lower prices. Good luck to all and Paula and I wish everyone the healthiest and happiest new year! 🙂

~George

Within Striking Distance!

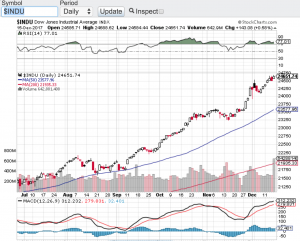
In my previous blog, I said I wouldn’t be at the very least surprised if the Dow Jones Industrial Average (see chart below) closed above 25000 by year end. Well don’t look now, we are in striking distance of that milestone. In fact, if the Dow does close above 25000 by year end, it would have taken it a month to do so. That’s right only a month! In late November the Dow closed above the 24000 mark for the very first time and now its a mere 350 points away from yet another 1000 point gain. What’s impressive about this 1000 point clip is how fast it is getting there, I mean a month? This is unprecedented for sure. Market observers are expecting this insatiable bull market to keep on truckin into the end of the year, especially if the tax bill goes live! The S&P 500 (chart) and the Nasdaq Composite (chart) also closed at records highs on Friday with the S&P 500 closing in on the 2700 mark and the Nasdaq approaching the 7000 mark. The small-cap Russell 2000 (chart) is lagging behind but on Friday the Russell did find support at its 200-day moving average to close higher on the week.

With only 2 weeks left in the trading year what can investors or traders expect? More of the same or a sell the news type event? The news being the proposed tax bill getting through and going live. I truly don’t know? However, when you add seasonality into the mix with December being one of the strongest months for stocks on the year, I would not be surprised if the Dow Jones Industrial Average does indeed eclipse the 25000 mark. We could also see the S&P 500 overtake 2700 and the Nasdaq surpass 7000. Now if there is a snag in getting the tax bill through or if it ends up being a “sell the news” type of event meaning the proposed tax bill does go through by year end, then I will have a much different take heading into the new year. Both Paula and I wish everyone the healthiest and happiest holiday season 🙂

~George

Dow Jones Industrial Average - Paula Mahfouz

What A Rollercoaster Ride!

This week started off with the vote no one expected. Global markets were shocked with the outcome of the United Kingdom’s vote to the leave the European Union. Here at home, the Dow Jones Industrial Average (see chart below) lost close to 1,000 points between Monday and Tuesday, the Nasdaq (see chart below) over that same two-day period lost close to seven percent as did the S&P 500 (chart) and the small-cap Russell 2000 (chart). A breathtaking 2-day drop which was so swift and profound that it violated the 200-day moving averages of all of the aforementioned indexes. Fast forward to today and what seemingly was the start of an angry correction, has turned into yet another “buy the dip” opportunity. No matter what the challenges are or have been on the macro-economic or political front, markets over the past several years have shrugged them off. I honestly did not think stocks would snap back this time as quickly and as powerfully as they have.

Yet again, oversold conditions created a trader’s dream with this snap-back rally. Ever since this bull market began, every shocking or unexpected headline which have rattled the markets have always been met with strong support that then turns into the resumption of this protracted bull market. However, it is also very clear that we have been trading in a range for quite some time now and every time we have tried to breakout of this trading range, resistance is met and we retrace back to a variety of moving averages.

So you may be asking how do we break out of this S&P 500 (chart) 2000 to 2120 trading range? One catalyst that can do this is the upcoming second quarter earnings reporting season which kicks off here in July. I do not think that the economy is such that record earnings results will come forward. In fact, companies may take it upon themselves to use the Brexit circumstance to soften their future guidance? We will see. In my humble opinion I think the possibility of a downward break is more probable in the near term than stocks breaking out to all-time highs, especially after this snap back rally. Good luck to all!

Paula and I wish everyone a safe and Happy 4th of July holiday 🙂

~George Mahfouz, Jr.
Dow Jones George Mahfouz JrNasdaq George Mahfouz Jr.

Stocks Are Back!

Since losing over 10 percent of their values and going into correction territory earlier this year, the major averages now find themselves almost back to par. Year-to-date the Dow Jones Industrial Average (chart)  is only down around one percent, the S&P 500 (chart) is also lower by around one percent, the Nasdaq (chart) on the year has gained back over half of its losses and the small-cap Russell 2000 (chart) is lower by 4.5%. Since this bull market began over seven years ago, time and time again stocks have demonstrated astounding resilience. Seemingly every time there is a sell-off, willing buyers are ready to step in at varying support levels and buy up equities.

Today the Federal Reserve left interest rates unchanged and actually slashed their forecast to project only two additional rate hikes for the rest of this year versus the four rate hikes they had originally targeted. Stocks initially popped on the news and only one can conclude that the continuing accommodating monetary policies not only here in the United States, but from around the world is most likely the reason why this seven year bull market continues.

That said, the aforementioned indices are approaching overbought conditions according to the relative strength index. Remember the RSI is one of the favorite technical indicators by market technicians, certain algorithmic programs and institutional investors alike. The relative strength index measures and compares the size of moves in a selected period of time and according to the RSI, the 70 or greater value level signals an overbought condition and the 30 value level or lower indicates an oversold condition. Keep in mind stocks and/or indexes can remain overbought or for that matter oversold for an extended period of time. Currently the Dow Jones Industrial Average (chart) is almost touching the 70 value level and the other indexes are not too far behind. Of course this is only one of many technical indicators that traders and investors utilize, but I have found over the years the RSI is one of the more reliable indicators out there.

Good luck to all 🙂

~George

Despite A Pop In Volatility, Bull Market Remains Intact!

In the month of July, the major averages continued to demonstrate what a bull market looks like despite an increase in volatility $VIX (chart )and global macro concerns. For the month, the Dow Jones Industrial Average (chart) closed up a modest 0.40%, the Nasdaq (chart) gained 2.8% in July, the S&P 500 (chart) advanced 2.0% and the small-cap Russell 2000 (chart) actually ticked down on the month giving up 1.28%. One interesting note and if you look at the charts of the above mentioned indices, in the month of July each of these indexes breached their 200-day moving average and three of the four breached this support line twice only to rebound sharply and keep the technical makeup of the markets intact. Without question and throughout this six year long bull run, the technicals of stocks and indexes have done their job and has acted as technicians would expect.

Fast forward to today August 1st and if you have been on Wall Street long enough, yes we are now entering the dog days of summer. As Q2 earnings reporting season works its way through and begins to wind down, I would expect volatility also begin to abate as it has towards the latter part of this past week. Without question these markets could still react to China’s extreme volatility as of late or if there is a big surprise in next week’s job’s report, however, without any big surprise here or overseas, I think this becomes a stock-pickers market as well as a technically traded market paying attention to trend lines and overbought and oversold conditions. This could also be the perfect environment to sell put option premium on your most favorite stocks in order to generate some additional income. One other option which may be a very valid one, and that is turn off your screens and head to the beach until after Labor Day :-).

Whatever you choose to do as we enter the “dogs days of summer” it is always best practice to consult with a certified financial planner(s) before making any investment decisions or changes to your portfolio. Good luck to all 🙂

~George