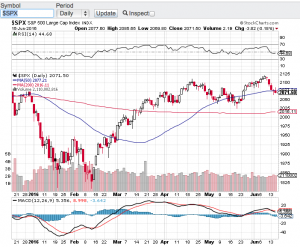
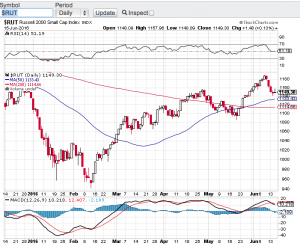
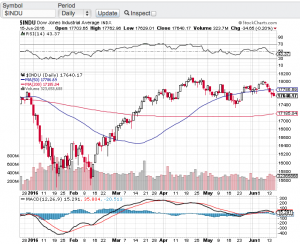
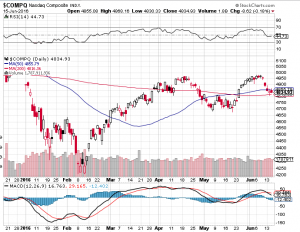
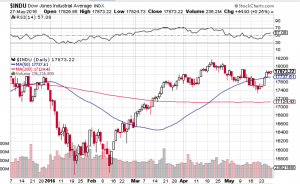
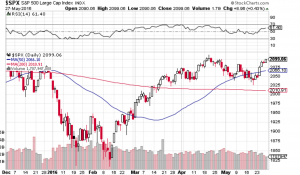
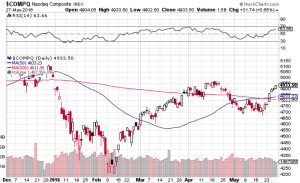
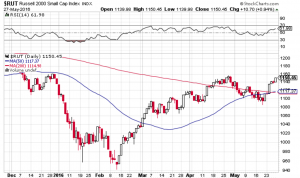
Looks Like A Double Top…

A recent attempt to breakout to all-time highs has seemingly failed. The Dow Jones Industrial Average (see chart below) , the tech-focused Nasdaq (see chart below), the S&P 500 (see chart below) and the small-cap Russell 2000 (see chart below) all appear to have “double topped” and have retreated to support lines. Without question growth concerns here in the United States are abound. These concerns escalated right after the release of May jobs report which was dismal to say the least. Couple these concerns with the potential of the United Kingdom leaving the European Union and its no wonder why the markets have pulled back over the past couple of weeks.

One of the risks to the markets that I highlighted in my last blog were interest rates. It appeared at the beginning of the month that the Federal Reserve and market pundits were all but certain that a rate hike would occur at today’s Federal Reserve meeting. Well thanks to the underwhelming May jobs report, no rate hike occurred this month and furthermore the Federal Reserve have lowered their outlook for any near term future increases! The Fed did say that they will be monitoring our economy and the data to guide them in their future policy decisions and sure enough they continue to stand by this protocol.

Now what? First for me, I want to see how the market reacts to next Thursday’s vote as to whether or not Britain leaves the European Union? Momentum does appear to be increasing for a British exit, which could lead to a global slowdown? Nobody knows if the referendum will pass or what type of effect this will have across the pond or here in the U.S. In the meantime, I will be monitoring the technical shape of our key indices and as you can see in the below charts each of these indexes have found support at either the 20-day, 50-day or 200-day moving averages.

Good luck to all 🙂

~George Mahfouz, Jr.

george mahfouz jr SPX chart

george mahfouz, jr Russell chart


george mahfouz jr Dow chart

george mahfouz jr nasdaq chart

Rate Hikes Are Looming…

Janet Yellen the chair of the Federal Reserve last Friday signaled that the Federal Reserve is prepared to raise interest rates in the coming months should the U.S. economy continue to improve. Some pundits suggest that a rate hike could come at the Fed’s next policy meeting in two weeks. Despite the rate hike chatter, the markets continue to shrug off what seemingly could be bearish for stocks. The Dow Jones Industrial Average (see chart below) is within striking distance of all time highs. Same can be said for the S&P 500 (see chart below), the Nasdaq (see chart below) finds itself flirting once again with the 5000 mark and the small-cap Russell 2000 (see chart below) appears to have caught a bid and is strengthening.

This type of market activity is counterintuitive when interest rates appear to be heading north. The flip side to this thinking is if the Federal Reserve is willing to raise rates due to a stronger economic back-drop, one can assume that this must be good for corporate America. Logically speaking I agree, however, if history has anything to do with the markets, a rising interest rate environment typically does not bode well for equities. Couple this with the seasonality of the summer months which tend to be weaker months for stocks and the upcoming fall presidential election, and I would say at the very least we will see a rise in volatility. These are very powerful forces that are lining up and I think it’s safe to say the markets will be very reactive to these events.

So what’s a trader or investor do in this landscape? For me personally I think the type of environment we are heading into creates opportunity on the long and short side. I will be paying close attention to overbought and oversold conditions of the markets and select equities throughout the summer and into the fall. As everyone knows by now my favorite technical indicator when it comes to spotting overbought/oversold conditions is the Relative Strength Index also known as the RSI. Many market technicians also favor this technical indicator when assessing market conditions from a technical standpoint. Over the years the RSI has demonstrated its usefulness and if you are not familiar with this technical indicator, you may want to research it out. Click here for starters.

Both Paula and I wish everyone a very safe, prosperous investing and trading summer 🙂

~George Mahfouz, Jr.

Screen Shot 2016-05-30 at 8.00.40 PMGeorge Mahfouz Jr. S&P 500 chartGeorge Mahfouz Jr. Nasdaq ChartGeorge Mahfouz Jr. Russell 2000 Chart