Strongest Performance In 5 Years…

Stocks took off in the first quarter with the S&P 500 (see chart here) delivering its strongest Q1 performance in 5 years gaining over 10%. The Dow Jones Industrial Average (see chart here) also closed Q1 with a gain of 5.6%, the Nasdaq Composite (see chart here) finished the quarter up over 9% and the small-cap Russell 2000 (see chart here) finished up around 5%. So, as I posted last month, stocks continue their record setting ways.

So why are the markets continuing to demonstrate strength despite interest rates remaining high relative to when this bull market started? I think part of the answer is right there. The Federal Reserve is continuing to indicate that three interest rate cuts remain in place for 2024 which is bullish for the markets.

Another first quarter driver of the markets can be attributed to the “Magnificent 7”. Nvidia (Symbol: NVDA), Meta Platforms (Symbol: Meta), Amazon (Symbol: AMZN), Microsoft (Symbol: MSFT), Alphabet (Symbol: GOOGL), Apple (AAPL) and Tesla (TSLA) are the Magnificent 7 and are responsible for 40% of the S&P 500’s (see chart here) gain in Q1. This dynamic too attributed to the momentum stocks witnessed in the first quarter although there are a couple of chinks appearing in the armor of the Magnificent 7 and that is the recent under performance of Apple and Tesla. Personally, I would like to see a broader rally here not just 7 stocks that are making up a big percentage of the overall gains.

That being said, and now that the first quarter of the year is in the books, earnings reporting season begins here in April. Earnings season should be the next catalyst as to where stocks and indexes go. As I just spoke to, I would like to see a broader based rally and Q1’s earnings results just might deliver results that could extend this year’s impressive rally. However, if corporate America issues flat to softer results, we could see a pause in this rally and even a potential pullback.

Good luck to all πŸ™‚

~George

Record Highs Continue…

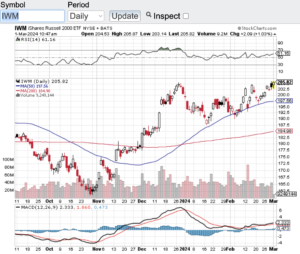
Record highs continue for the Dow Jones Industrial Average (see chart here) and for the S&P 500 (see chart here). In February, the Dow Jones Industrials hit an all-time high of 39282 while for the first time ever, the S&P 500 (see chart here) crossed the 5000 mark trading as high as 5111. These two indexes continue to demonstrate impressive strength along with the Nasdaq Composite (see chart here). It appears that the Nasdaq Composite just might join the Dow Jones Industrials and S&P 500 in hitting a fresh all-time high anytime. The small-cap Russell 2000 (see chart here & below) still has a way to go to reach its all-time high but at least this index is trending up.

Stocks aren’t the only asset class at or near all-time highs, Bitcoin has broken out as of late and has surpassed $60,000 per coin mark. The momentum continues here since Bitcoin ETFs were approved. Now this asset class in not for the faint of heart. As much as Bitcoin continues to rip, sell-offs in this asset class can be dramatic and fast.

So, what is going on with these all-time highs and the “risk on” spirit from institutional investors and retail investors alike? For one, I think the strength of the economy has something do to with this, however, I believe that rampant speculation is also play a role. Especially out of the artificial intelligence sectors as stocks there also continue to make all-time highs. My concern is how long this most recent rally has lasted. For example, the S&P 500 (see chart here) has seen gains in 15 of the last 17 weeks which is rarely seen.

With that being said, as I look at the technical shape of the aforementioned indexes, they are not in overbought territory according to the relative strength index aka the RSI. Many market technicians use this key technical indicator to gage whether a stock or index is overbought. 70 is the key value level of the RSI that would indicate an overbought condition and the major averages are trading below this mark. Now this is only one technical indicator and there are clearly many other factors that determine the state of the markets, but as of now nothing appears to be getting in the way of this impressive months long rally.

Good luck to all πŸ™‚

~George

All Time Highs Continue - Paula Mahfouz

Cheers To The Markets!

Cheers to the markets and what a year for stocks! 2023 turned out to be a spectacular year for the stock market as not many expected the markets to rip-roar as it did last year. The Dow Jones Industrial Average (see chart here) finished the year up almost 14 percent. The S&P 500 (see chart here) closed the year up 24%. The Nasdaq Composite (see chart here) closed the year up a whopping 44 percent. A big part of the Nasdaq’s eye-popping performance was how the “Magnificent 7” performed. For those of you who do not know who the Magnificent 7 are, it is the big tech group made up of Apple (NasdaqGS: AAPL), Microsoft (NasdaqGS: MSFT), Google owner Alphabet (NasdaqGS: GOOGL), Amazon (NasdaqGS: AMZN), Nvidia (NasdaqGS: NVDA) and Meta Platforms (NasdaqGS: META) and Tesla (NasdaqGS: TSLA). Finally, the small-cap Russell 2000 (see chart here) closed the year up 15%.

Many stock market experts did not expect such a stellar year for stocks. Let’s dig in and see what happened. For starters, inflation itself retreated faster than anyone expected which now has the Federal Reserve speaking to cutting rates in 2024. This metric alone is very bullish for stocks. Then factor in how strong the economy has been it’s no wonder we are at or near all-time highs. What’s equally impressive is how the markets have shrugged off the geopolitical backdrop. From two wars that seemingly have no end is sight, to the U.S. political divide, to China’s stagnant economy, nothing seems to be bothering the markets, at least not yet.

As we now look forward to 2024, I think we are in for a doozy of a year, at least from a volatility standpoint. We are also in an election year, and this alone should create higher volatility. I would also expect that after such a strong performance in 2023 that a pause and/or even a correction of some sort could potentially be in the cards for the markets in general.

Wishing everyone the healthiest, happiest, and most prosperous new year πŸ™‚

~George

A Mixed Month For Stocks…

The month of May was a mixed month for stocks and the major averages. The Dow Jones Industrial Average closed out the month down 3.5% (see chart here) while the S&P 500 (see chart here) and the Nasdaq Composite closed the month out in the green. The small-cap Russell 2000 (see chart here) like the Dow closed the month out lower. Not bad considering how the debt ceiling issue and debate has been in the news seemingly hourly as everyone waits with bated breath as to what Congress will do. To me I wonder why this drama about raising the debt ceiling so the government can pay its debt and obligations is always a thing? Why even have a debt ceiling when there is no way United States of America could ever default on its debts and obligations. If this was to occur a global meltdown like never before seen could occur. How about this concept? No debt ceiling at all and instead vote in a fiscally responsible administration and politicians to manage our country’s finances properly. Sounds simple enough, but who am I kidding. Ok, enough of this and back to the markets.

Despite being an historically softer month for the stock market, May did not perform too bad as evidenced above. Yes, a mixed bag, but I think investors are happy to see that we didn’t fall off a cliff. That being said, as a look at the technical shape of the aforementioned indexes what is standing out to me is how key support lines are in play. The Dow Jones Industrial Average (chart) is hovering right around its 200-day moving average, while the S&P 500 (chart) is currently being supported by its 20-day moving average. The Nasdaq Composite (chart) is trading nicely above it’s 20, 50 and 200-day moving averages while the small-cap Russell 2000 (chart) is bouncing around its 20-day MA.

Lastly, I think the markets are in a position to continue its recent trading patterns and as soon as the final vote comes in on the debt ceiling matter, everyone will breathe a sigh of relief.

Good luck to all πŸ™‚

George

What A Month For Stocks!

What a month for stocks as the major averages rebounded sharply in July. After witnessing an incessant selloff over the past few months, July turned out to be the best month for stocks in years. After falling into bear market territory, the S&P 500 (see chart here) gained almost 10% last month cutting its year to date losses in dramatic fashion. As I look at the Dow Jones Industrial Average (see chart here) a thousand-point gain in the last week or so is not too shabby either. Last but not least, both the Nasdaq Composite (see chart here) and the small-cap Russell 2000 (see chart here) also has enjoyed a strong recovery from their recent lows.

So why was there such a strong performance in the month of July? Q2 earnings reporting season is in full swing and at best this Q2 earnings so far have been a mixed bag. The Fed last week also raised interest rates another 0.75%. Inflation remains at or near 40-year highs. So, if you solely look at these metrics one would think the recent selloff would be accelerating. Clearly this is not the case, yet! The bears would argue that this is an “oversold” bounce and part of me agrees with that. However, I think it is too early to say that we are back to a full-fledged bull market. I do think if the markets remain stable over the next couple of months this could be a sign of a bottoming process. Let’s see how the rest of the summer plays out.

Now let’s move over to the technical shape of the aforementioned indexes. What has caught my eye is how the major averages are either at or have recaptured their 100-day moving average. This important support and/or resistance line is key as to whether stocks will pause into the resistance that moving averages experience, or if the momentum continues, then this could mean that this latest bull run will continue.

Good luck to all πŸ™‚

~George

A First Half To Forget…

Needless to say, the first half of the year needs to be forgotten. Stocks took it on the chin as the major averages have lost meaningful ground so far in 2022. Year to date, the Dow Jones Industrial Average (see chart here) is down over 14%, the S&P 500 (see chart here) is off by almost 20%, the Nasdaq Composite (see chart here) is down almost 30% and the small-cap Russell 2000 (see chart here) year to date is down 23%. As mentioned above, a first half to forget.

As I spoke to in my last blog, I believe we are in a “new norm” pertaining to the stock market. For years stocks have traded at a premium due to the accommodative policies implemented by the Federal Reserve banks from around the globe. Fast forward to today and we are now in a much different environment. Fed banks across the globe are now raising rates to stem off inflationary pressures. I think this policy shift is long overdue and actually very healthy for the stock market. Sure the pain is real from this correction and current bear market, but now that rates are starting to normalize, keyword “starting”, investors can have more confidence in how to gauge and measure value in stocks. Before, it was virtually impossible to properly analyze stocksΒ  due to the the accommodative fed policies which included years of zero percent interest rates and government stimulus programs. This backdrop added higher multiples to most asset classes which simply was not sustainable. Now that we are heading back to an even playing field, we can all have more confidence that stocks will begin to trade at their true value and if they are not trading at their real value, we can now identify more accurately undervalued or overvalued stocks and act accordingly.

Wishing everyone a very safe and Happy 4th of July weekend!

~George

The New Norm…

I think it is becoming safe to say that we are now in the new norm! The stock market for over a decade has feasted on the Federal Reserve’s accommodative policies and most recently the stimulus provided by governments from around the world during the pandemic. Under normal market conditions, stocks trade on their own merits and prospects. This has simply not been the case in years. Fast forward to today and we now have a Federal Reserve raising interest rates, reducing their own stimulus programs to stave off inflation and get back to more normalized Fed policies and procedures. Now the markets are taking notice. Volatility in the markets continue as has been the case for months now. Year to date, the Dow Jones Industrial Average (see chart here) is down 10 percent, the S&P 500 (see chart here) is lower by 15%, the Nasdaq Composite (see chart here) on the year is down almost 25% and the small-cap Russell 2000 (see chart here) is down about 18%.

Yes, I believe we have entered a new norm. Which isn’t necessarily a bad thing from the standpoint of properly evaluating companies. What’s been very difficult during the past decade or so is how to evaluate public companies. The Federal Reserve and its unprecedented accommodative monetary policies was a huge driver of how companies were valued. Meaning this, when there are hardly any choices of attaining yield whether it is from stocks or bonds, this forces capital into the stock market or other higher risk assets. This has been one of the primary drivers of the incessant bull market investors have enjoyed over the years. Now, companies are going to have to perform to maintain their position in the marketplace. The ones that do, will be rewarded, the ones that don’t will experience adjustments in their valuations.

With all the above being said, I am confident that once the stock market bottoms out, there will be great opportunities to consider and act on. Good luck to all πŸ™‚

~George

A Tough Quarter For Stocks…

It was a tough quarter for stocks as the markets dealt with and continues to deal with the war in Ukraine, runaway inflation, rising interest rates and the seemingly never ending Covid dynamic. For Q1, both the Dow Jones Industrial Average (see chart here) and the S&P 500 (see chart here) lost nearly 5%. The Nasdaq Composite (see chart here) lost more ground closing out the quarter down 9%. Last but not least, the small-cap Russell 2000 (see chart here )Β  also closed Q1 down 9 %.

As mentioned above, it was a tough quarter for stocks and indexes but with the current state of global backdrop my feelings are we are quite lucky to not of experienced more of a drawdown. In fact, I am very surprised if not shocked that we did not see a 20 percent sell-off or more due to these major headwinds. So, this begs the question as to why there was not more of a correction? Could it be corporate earnings will surprise the street once Q1 earnings reporting season kicks off here in April? Or could it be that while interest rates are going up and will continue to do so, that rates are still relatively low, and money continues to get put to work in the overall markets? I do think that this upcoming earnings reporting season will be one of the most important metrics in years pertaining to whether stocks find their footing or continue to be under pressure. The one other metric I will be paying close attention to is yield curve inversion. For the first time in years the 2-year Treasury yield surpassed the 10-year and historically when that happens the chances for a recession increase. So, as you see there is much to learn over the coming weeks and throughout the summer.

Last but not least, when I look at the current technical shape of the aforementioned key indexes, all of them are trading right around their respective 20-day, 100-day and 200-day moving averages. Based on this action it is possible that we see a breakout above and/or a breakdown below these historic support and resistance lines.

Good luck to all πŸ™‚

~George


Volatility Hits The Markets…

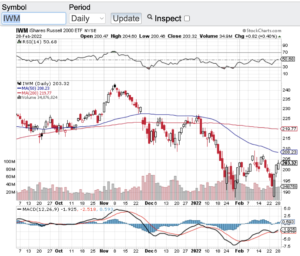
Volatility has hit the markets to the point that the VIX (see chart here) aka the fear gage has broken out. Stocks have been on a tear as of late but unfortunately to the downside. No one is surprised that the markets have become extremely volatile due to the Russian invasion of Ukraine. The Dow Jones Industrial Average (see chart here) fell over 10% since the crisis began as has the S&P 500 (see chart here). Both the Nasdaq Composite (see chart here) and the small-cap Russell 2000 (see chart here and below) have sold off closer to 15% before bouncing off of their sell-off lows. Again, no surprise that vol has spiked to almost a double over the past few weeks as tensions increased.

Before we get into the technical shape of the markets it’s hard for me to even talk stocks and indexes due to the atrocities happening abroad. Our prayers go out to everyone in the Ukraine that is being affected by this invasion and for the people of Russia who wants no part of this. Hopefully very soon a cease fire will happen and happen for good!

Now let’s look at the technical set-up that has occurred since the buildup and invasion with the aforementioned key indexes. Starting with the Dow Jones Industrial Average (see chart here). The Dow a few days ago hit a low of 32272 and has bounced to the 34,000 zone. There is much more work here to be done before the Dow can recapture its 100 and 200-day moving averages. The same can be said for the S&P 500 (see chart here) although with the S&P, it is closer to its 20-day M/A than the Dow Jones Industrials Average. Interestingly both the Nasdaq Composite (see chart here) and the small-cap Russell 2000 (see chart here) have bounced off of their recent lows stronger with the Russell 2000 recapturing its 20-day M/A. Despite the recent bounces off of their sell-off lows I think it is fair to say that we are not out of the woods yet in the volatility we have seen as of late. If you are a long-term investor, this will pass at some point in time. For experienced traders this is an environment where money can be made both on the long and short side of the markets. That said, I always recommend consulting your certified professional financial advisor(s) before making any moves in the backdrop we currently find ourselves.

Good luck to all πŸ™‚

~George

Volatility Hits The Markets - Paula Mahfouz

Risk On Remains On!

Risk on in the markets remains on as we approach the second half of the year! It’s truly remarkable to me how stocks, crypto, real estate and other asset classes are still trading at or near all time highs. I do get that the ongoing accommodative policies provided by our Federal Reserve and from central banks across the globe is the main reason why asset prices continue their bullish ways.

That said, I do think it is time to start considering how things could look once the Federal Reserve in our country starts backing away from its accommodative monetary policies and as interest rates begin to normalize. This is not a question of if, it’s a question of when. Tell tale signs of inflation are now seemingly everywhere which is what the Federal Reserve is paying close attention to and could be the catalyst for the Fed to act. It is at this point our markets could be adjusting to align with real interest rates and normalized price to earning multiples. To that end, we have and continue to witness the most unique market conditions ever seen. So I am not calling a top here and I do respect the power of the Federal Reserve, however, I am just suggesting that we may see a healthy and overdue adjustment in asset prices which may not be such a bad thing. There are many investors that are on the sidelines and would be more than happy to step in should we see asset prices adjust to a lower entry point.

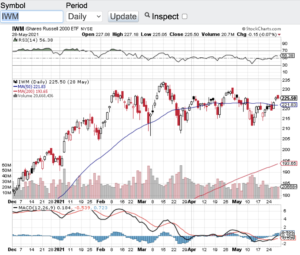
Let’s take a quick look at the technical shape of the major averages. The Dow Jones Industrial Average (see chart here), the S&P 500 (see chart here), the Nasdaq Composite (see chart here) and the Small Cap Russell 2000 (see chart below) all are trading above their 20, 100 and 200 day moving averages. This alone is a strong technical backdrop and what’s more is none of the aforementioned indexes are currently overbought according to the relative strength index aka the RSI. So technically speaking things look pretty good right now.

Good luck to all πŸ™‚

~George

Risk On Remains On - Paula Mahfouz