Red Week For Stocks, Technicals In Play…

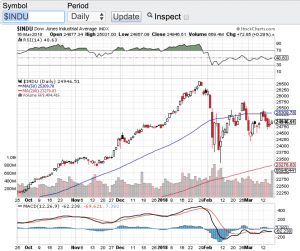
Stocks had a tough week pressured by the prospects of rising interest rates and political turmoil out of Washington D.C. On the week, the Dow Jones Industrial Average (see chart below) closed lower by 1.5%, the S&P 500 (chart) closed the week down 1.2%, the Nasdaq Composite (chart) finished lower by 1% and the small-cap Russell 2000 (chart) ended the week down around 1% as well. Despite a choppy and red trading week, all of the aforementioned indexes are still up on the year.

As we celebrate St. Patrick’s Day we find ourselves in a period of no real short term catalysts to steer the market in either direction other than the FOMC meeting next week. I don’t expect the Federal Reserve to surprise the markets with a larger than expected interest rate hike or change their view on interest rate policy this year. The inflation data continues to remain tame although the labor market is heating up. So what is going to drive stocks between now and Q1 earnings reporting season in April?

When we find ourselves in a period such as the one we are in, I focus in on the technical shape of the markets. And as you can see in the charts of the major averages, all of them are at their moving averages support. Whether it’s the 9 day, 20 day, 50 day, 100 or 200 day moving average, stocks and indexes typically respect and is supported by moving average support lines with the 200 day moving average being the most reliable out of all of them. This doesn’t mean that this favorite technical indicator of most market technicians is infallible, but it sure has a history of being an effective tool when navigating the markets. All things considered, including the seasonality of the markets, I do expect that these support levels should hold at least until Q1 earnings reporting season. If the moving averages don’t hold, then I would not be surprised if we revisit the early February market correction lows. Good luck to all and Paula and I wish everyone a safe and Happy St. Patricks Day 🙂

~George
Dow Jones Industrial Average - Paula Mahfouz

First Quarter In The Books…

Q1 proved to be a mixed bag for the major averages. The Dow Jones Industrial Average (chart) closed out the first quarter up almost 1.5%, the S&P 500 (chart) finished up 0.77%, however, both the Nasdaq (chart) and the small-cap Russell 2000 (chart) finished out the first quarter of the year lower by 2.75% and 1.78% respectively. Not too shabby considering these key indices were down over 10% earlier in the quarter. This morning stocks are lower despite a stronger than expected  jobs report. In March, the economy added 215,000 jobs with the unemployment rate now at 5%.

With Q1 in the rear view mirror all attention will now be focused on first quarter earnings reporting season. The Commerce Department recently issued a report indicating that corporate profits were down 15% year-over-year. This does not bode well for stocks when the current p/e ratio’s of the major averages are well above their historic averages. With earnings reporting season just ahead, we will not have to wait too much longer to see how well corporate America is doing.

Let’s take a quick look at the technical shape of the markets. Most of the key indices are at or near overbought conditions, which has been the case for pretty much most of March. In my previous blog I eluded to what most market technicians look at when gauging overbought or oversold conditions. Furthermore and technically speaking, the major averages are all trading at or above their 20, 50 and 200-day moving averages with only the small-cap Russell 2000 (chart) chasing its 200-day. If you are bullish on the market, these moving average patterns are typically a good thing. That said, I do expect volatility to pick up a bit which is usually the case ahead of earnings reporting season. I will check back in mid-month or so to see how earnings growth actually appears.

Good luck to all 🙂

~George

Stocks Are Back!

Since losing over 10 percent of their values and going into correction territory earlier this year, the major averages now find themselves almost back to par. Year-to-date the Dow Jones Industrial Average (chart)  is only down around one percent, the S&P 500 (chart) is also lower by around one percent, the Nasdaq (chart) on the year has gained back over half of its losses and the small-cap Russell 2000 (chart) is lower by 4.5%. Since this bull market began over seven years ago, time and time again stocks have demonstrated astounding resilience. Seemingly every time there is a sell-off, willing buyers are ready to step in at varying support levels and buy up equities.

Today the Federal Reserve left interest rates unchanged and actually slashed their forecast to project only two additional rate hikes for the rest of this year versus the four rate hikes they had originally targeted. Stocks initially popped on the news and only one can conclude that the continuing accommodating monetary policies not only here in the United States, but from around the world is most likely the reason why this seven year bull market continues.

That said, the aforementioned indices are approaching overbought conditions according to the relative strength index. Remember the RSI is one of the favorite technical indicators by market technicians, certain algorithmic programs and institutional investors alike. The relative strength index measures and compares the size of moves in a selected period of time and according to the RSI, the 70 or greater value level signals an overbought condition and the 30 value level or lower indicates an oversold condition. Keep in mind stocks and/or indexes can remain overbought or for that matter oversold for an extended period of time. Currently the Dow Jones Industrial Average (chart) is almost touching the 70 value level and the other indexes are not too far behind. Of course this is only one of many technical indicators that traders and investors utilize, but I have found over the years the RSI is one of the more reliable indicators out there.

Good luck to all 🙂

~George

The Moment Of Truth May Be Upon Us…

We may be entering a period of where good economic news may be bad for stocks? U.S. gross domestic product bounced back sharply at a seasonally adjusted annual rate of 4% in Q2, according to the Commerce departments G.D.P. report issued on Wednesday. This was surprisingly higher than the consensus forecasts of 3% growth for the second quarter. Now wait a minute, isn’t economic expansion good for stocks? Well not if the markets have relied on ultra low interest rates and assets purchases by the Fed as the cushion and floor to the stock market. Stocks had one of their worst performances of the year yesterday and for the month of July the Dow Jones Industrial Average (chart) lost 1.56%, the tech heavy Nasdaq (chart) gave back 0.87%, the S&P 500 (chart) -1.5% and the small-cap Russell 2000 (chart) closed the month of July lower by an eye-popping 6.1%. Now the question becomes is this the beginning of a longer term trend in the marketplace or just another buying opportunity? Personally, I am a bit concerned over the set-up of the markets in general and it’s no secret a correction in equities has been long overdue. Add to the mix that historically and seasonally, August through October hasn’t been a favorable time for stocks. So I think erring on the side of caution may be the wise thing to do.

Let’s take a look at the technical set-up of the aforementioned key indexes. The first thing I want to look at is whether or not the markets are overbought or oversold according to the RSI principle. The relative strength index a.k.a. the RSI, is a technical indicator that compares the size of moves of both recent gains and losses to determine overbought and oversold conditions. The 70 value level and higher and the 30 value and lower are considered extreme conditions. As of the close of trading yesterday, the Dow Jones Industrial Average (chart) RSI was at 32.09, the Nasdaq (chart) RSI was at the 44.24 value level, the S&P 500 (chart) RSI was at 35.85 and the small-cap Russell 2000 (chart) RSI was at 34.76. So as you can see these key indices are not yet in extreme oversold conditions. From a technical standpoint, my preference is to enter positions only when extreme conditions occur, that is when RSI levels are below 30 or above 70. Of course this position has to be supported by strong fundamentals as well. When you have both factors going for you, chances are the set-up would most likely provide favorable results.

Now another favorite technical indicator of mine are the moving averages. The 20-day, the 50-day and the 200-day are the most popular moving averages certain market technicians utilize. The moving average lines historically provide support and/or resistance depending on which side of the line the asset resides. As of the close of yesterday, the Dow Jones Industrial Average (chart) fell below its 50-day moving average for first time since mid-May, the Nasdaq (chart) fell below its 20-day, however, its still trading above its 50-day and may find some support there? Looking at the S&P 500 (chart), it too has fallen below its 50-day moving average and the small-cap Russell 2000 (chart) has now taken out its 200-day moving average and is technically the weakest index of the group.

So as you can see, the markets are not yet in extreme oversold conditions according the the RSI principle and the moving averages are currently being violated, which may indicate that the selling pressure may not be over. Of course this is only a technical recap of current market conditions which is only one component that can shape the markets. Please remember that it is best to always consider consulting with a certified financial planner(s) before making any adjustments to your portfolio or developing any investment or trading strategies .

Best of luck to all 🙂

~George

Tough week for stocks…

Earnings reporting season is in high gear and the markets are not liking what they are seeing. For the week, the Dow Jones Industrial Average (chart) fell 1.77%, the Nasdaq (chart) -0.59%, the S&P 500 (chart) -1.99% and the small-cap Russell 2000 index (chart) declined 2.89%.

For the most part, corporate America continues to show a slowdown in their businesses and companies are also providing tepid outlooks in the near term citing the uncertainty of the pending fiscal cliff, and the expiration of the Bush era tax cuts. Even tech-titan Apple (NasdaqGS: AAPL) guided with an outlook that caught the street off guard. Despite the disappointing earnings reporting season so far, the key indices have managed to remain above their respective 200-day moving averages. The 200-day is one of the most closely watched key technical support indicator that market technicians and institutional investors respect.

Next week, Q3 results will continue to pour in so I expect that the 200-day will once again be tested. If this is the case, and this key technical level can hold, we just may make a run into the end of the year? Good luck to all.

Have a great weekend 🙂

~George