Fear Of A Global Pandemic Grips Markets!

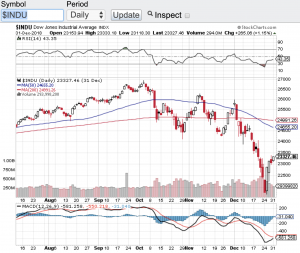
Stocks went into a tailspin as fear of a global pandemic grips the markets! New outbreak clusters of the highly contagious coronavirus are beginning to surface which is pressuring leaders from around the world to act and act more aggressively. Stocks have also entered correction territory as companies and analysts begin to ratchet down their revenue and earning forecasts. Over the past week or so the Dow Jones Industrial Average (see chart here) has lost over 10% in the past week alone, the S&P 500 (see chart here) has also entered into correction mode, the Nasdaq Composite (see chart here) has been hit hard and the small-cap Russell 2000 (see chart here) is also witnessing a sharp sell-off.

Personally I believe a correction was needed because of how robotic the markets have acted. Stocks no matter what risks were out there behaved in a way never before seen. We have been in the strongest bull market ever and nothing over the past 12 years could slow this bull market down. Now I am not happy that it is a global health risk that’s the catalyst to put stocks in correction mode, but nonetheless this is where we find ourselves. Of course when fear is rampant in any market this is where opportunity can be found. I am not suggesting to jump in here because as we all know fear and/or greed can be excessive and markets tend to over do it when emotions take the lead over rational thinking. So when we get overextended to the upside or downside the first thing I look at is how the technicals look during extreme market moves.

When I now look at the technical shape of the markets at least at it pertains to the moving averages things do not look so good. The Dow Jones Industrial Average (see chart here), the S&P 500 (see chart here) and the Russell 2000 (see chart here) have all breached their 20-day, 100-day and 200-day moving averages which are all seen as major support zones especially the 200-day. The Nasdaq Composite (see chart here) is the only major index that has yet to close below its 200-day. That said, all of the aforementioned indexes are oversold according to the relative strength index (RSI) which when we see the 20 value level hit on any stock or index, snap back rallies can and do occur. This type of market is great for traders if you are experienced enough to trade off of technicals, however for investors that have a long term view these type of market environments requires a lot of patience and keeping the emotions at bay. Let’s all hope that the spread of the coronavirus abates and that a vaccine becomes available as quickly as possible.

Good luck to all 🙂

~ George
Best Start Of The Year In Decades!

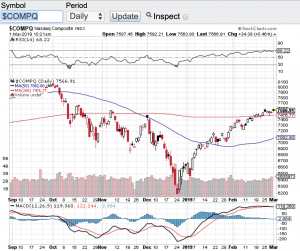
Stocks have opened the month of March rip roaring again adding to the best start of the year for the averages in decades. The Dow Jones Industrial Average (see chart here) opened the trading day up over 200 points, the S&P 500 (see chart here) opened up over 20 points, the Nasdaq Composite (see chart below) opened up over 55 points and the small-cap Russell 2000 (see chart here) opened up over 11 points. These gains are adding to the double digits percentage gains the markets have already realized in 2019.

So why such a strong start to the year? I am not trying to sound like a broken record but this 10 year long bull market is a head scratcher.  No matter what has been thrown at one of the longest bull markets in history, nothing seems have an adverse affect. You name the crises and stocks shrug it off. Whether it is a geopolitical event, the Federal Reserve raising rates or the daily chaos that comes out of Washington, nothing has disrupted this incessant rise in stocks. We did get a definitive correction late last year in where the bears came out of hibernation and predicted the end of the bull market and that a 40% correction is now imminent. Well don’t look now but we are not too far off from setting new all time highs in the aforementioned indexes.

Technically speaking it appears that the coast is clear for now as well. All of the major averages are now trading above their respective 20-day, 50-day and 200 day moving averages which is a very bullish sign. The one caveat to the technical shape of the market is that stocks are a bit overextended. Overbought conditions do exist technically and according to the relative strength index also known as the RSI. That said, the pullbacks that do occur continue to be met with support with buyers stepping in willing to add to their existing positions or open up new positions. The trend remains your friend in our current environment. Good luck to all 🙂

~George

Nasdaq Composite - Paula Mahfouz

Happy New Year!

Happy New Year! Well if you have been long the markets and with the way stocks closed out 2018, it wasn’t so happy for the bull camp. However, a new year means new beginnings :-). Let’s do take a gander to see how the major averages fared in 2018. The Dow Jones Industrial Average ( click here or see chart below) finished the year down 5.6%, the S&P 500 (chart) closed the year down 6.2%, the Nasdaq Composite (chart) closed down 4% and the small-cap Russell 2000 (chart) closed 2018 down 12%. This is the worst performing year for stocks in a decade.

So what happened? In my view and simply put how can stocks go up in a straight line for over a decade without a correction? That’s right, stocks essentially have gone up for over 10 years’ without a healthy 20% correction. So when the markets finally had a real correction which is what occurred in the 4th quarter, it felt like the sky was falling. No question the Federal Reserve and rising interest rates have played a role in the market correction, however, let’s keep this in mind a 2-2.5% Fed funds rate is still historically low. What wasn’t normal over the past decade was a 0 percent interest rate policy and no market volatility. Everyone got spoiled with such an accommodative policy and market environment.

Another factor playing into the mix of the Q4 market correction is without question the trade war and tariffs that our President has ignited. This to me is even more of an issue to our economy than rising interest rates lifting to a normalized level. Not only is the trade war and its ramifications playing a role, but the inconsistency and chaos out of Washington are wreaking havoc on the markets.  No doubt in my mind that investors and Wall street are falling out of love with how our country is being governed, especially over Twitter. This is all fixable, we will just have to wait and see if the ego’s and the political agendas on both sides of the aisle can get the confidence back in our marketplace. Paula and I wish everyone the happiest and most prosperous 2019.  Good luck to all 🙂

~George

Dow Jones Industrial Average - George Mahfouz Jr

A Long Overdue Correction!

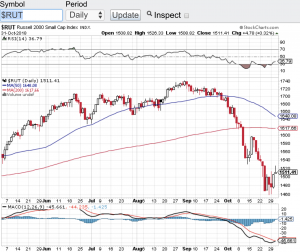
It was a spooky time for the equity markets in October as stocks experienced a long overdue correction. You have to go back seven years to have a month that sold off in the way the markets behaved in October. Yes, historically October has been one of the most volatile months of the year. The problem with historical data over the past several years is most of the time history has NOT repeated itself. Stocks have been on a tear for years breaking record after record. In fact not that long ago all of the major indexes had set all time record highs. Fast forward to today and we find the Dow Jones Industrial Average (chart) down almost 7% from its recent all-time high, the S&P 500 (chart) actually fell at one point over 10% from its all-time high finishing the month of October down 8%, the Nasdaq Composite (chart)  is down over 10% from its recent all-time high and the small-cap Russell 2000 (see chart below) is off over 13% from its all-time high recorded on August 31st of this year. So I think it is safe to say most of the market is in correction mode.

Next question, is this a healthy correction for the markets and will stocks find their bottom here or could this be the start of our first bear market in a decade? I guess the answer depends upon who you ask. I think it is too early to call out that a bear market is in the making, but one thing is for sure, we have not seen sustained volatility as we have witnessed recently in a very long time. As long as the trade war rhetoric continues to spew out of Washington and as long as the Federal Reserve keeps its foot on the gas pertaining to interest rates, I think the wild swings and volatility will continue. Oh yea, there is also this small event next week called the “mid-term elections” which should also play a key role in continuing vol. Good luck to all 🙂

~George

Russell 2000 - Paula Mahfouz

Finally A Market Selloff!

In my last blog, I eluded to a market selloff that just did not happen and I was referring to how stocks typically behave in the August and September. Instead of markets selling off at the end of summer, stocks were setting records. Well the bears got what they had been anticipating over the summer and that is an eye-popping market drop last week. Over the course of two days the Dow Jones Industrial Average (chart) fell over 1300 points. Of course the S&P 500 (chart), the Nasdaq Composite (chart) and the small-cap Russell 2000 (chart) all fell in harmony as well. What’s more these bellwether indexes all breached their 200-day moving averages for the first time in months with the Dow Jones Industrial Average (chart) recapturing and closing above its 200-day on Friday, the Nasdaq Composite (chart) just closed shy of its 200-day, the S&P 500 (chart) literally closed right at its 200-day however, the small-cap Russell 2000 (chart) closed out last week meaningfully below its 200-day moving average looking to find some sort of support. The 200-day moving average is widely regarding by market technicians and institutional investors as a key metric of support and or resistance.

What does all this mean? First, a market that constantly goes up with no retracement to speak of can never be healthy long term. There must be backing and filling along the way so that the risk of a sudden and potentially drastic drop doesn’t occur as what we witnessed last week. I mean c’mon going up in the way that we have over the past decade is not only unheard of but the risk that can come forward from this can spark a nasty correction. I am not suggesting that this will be the case but for the first time since earlier in the year, investors and traders felt the selloff last week.

Earnings reporting season kicks in this week with hundreds of companies set to report. Let’s see if corporate earnings can buoy the market here during this long anticipated selloff. Good luck to all 🙂

George

2 Percent – That’s It?

What should of been at least a 5-10% correction last week, the major averages barely flinched. This despite North Korea incessant threats of a nuclear attack against the U.S. and President Trump’s response that “fire and fury” will be unleashed by the U.S. in such an event. I am truly in disbelief that the markets did not take this geopolitical risk to correct in a more meaningful manner. In fact stocks yesterday had their best single day of the summer. Now we find ourselves yet again near all time highs. The Dow Jones Industrial Average (chart) closed just shy of 22,000, the S&P 500 (chart) is just under its all-time high of 2490, the Nasdaq (chart) closed at 6430 and the small-cap Russell 2000 (chart) closed Monday’s session at the 1395 level.

Talk about passive, machine driving algorithmic trading. One thing that really stands out to me is how the S&P 500 (chart), Nasdaq (chart) and the Russell 2000 (chart) all held their major moving average support lines. In particular the S&P and Nasdaq’s 50-day MA and take a look how powerful the Russell 2000’s 200-day moving average held and bounced (chart). It is clear that program trading models worked to perfection on this recent market pullback at least pertaining to key technical support levels.

So are we out of the woods pertaining to the risk trade? I am not so sure. But my goodness how can anyone have any kind of short thesis on these markets. Not even the heightened and continuing threat of a nuclear attack can rattle these markets more than 2 percent. Now that the rhetoric coming out of North Korea has abated for now, it could be business as usual as traders and investors get back to focusing on corporate earnings and fed policy. Whatever the case is I continue to be baffled by the strength of the U.S. stock market and without a doubt the old adage “don’t fight the tape” couldn’t be more true this year.

Good luck to all 🙂

~George

Stocks Are Back!

Since losing over 10 percent of their values and going into correction territory earlier this year, the major averages now find themselves almost back to par. Year-to-date the Dow Jones Industrial Average (chart)  is only down around one percent, the S&P 500 (chart) is also lower by around one percent, the Nasdaq (chart) on the year has gained back over half of its losses and the small-cap Russell 2000 (chart) is lower by 4.5%. Since this bull market began over seven years ago, time and time again stocks have demonstrated astounding resilience. Seemingly every time there is a sell-off, willing buyers are ready to step in at varying support levels and buy up equities.

Today the Federal Reserve left interest rates unchanged and actually slashed their forecast to project only two additional rate hikes for the rest of this year versus the four rate hikes they had originally targeted. Stocks initially popped on the news and only one can conclude that the continuing accommodating monetary policies not only here in the United States, but from around the world is most likely the reason why this seven year bull market continues.

That said, the aforementioned indices are approaching overbought conditions according to the relative strength index. Remember the RSI is one of the favorite technical indicators by market technicians, certain algorithmic programs and institutional investors alike. The relative strength index measures and compares the size of moves in a selected period of time and according to the RSI, the 70 or greater value level signals an overbought condition and the 30 value level or lower indicates an oversold condition. Keep in mind stocks and/or indexes can remain overbought or for that matter oversold for an extended period of time. Currently the Dow Jones Industrial Average (chart) is almost touching the 70 value level and the other indexes are not too far behind. Of course this is only one of many technical indicators that traders and investors utilize, but I have found over the years the RSI is one of the more reliable indicators out there.

Good luck to all 🙂

~George

A Respite From The Sell-Off!

Stocks snapped back sharply on Friday after a week of relentless selling pressure. On Friday the Dow Jones Industrial Average (chart), surged 313.66 points, the Nasdaq (chart) popped 70.67 points, the S&P 500 (chart) notched a gain of 35.70 points and the small-cap Russell 2000 (chart) closed Friday out up 18.27 points. For most of last week the markets were under tremendous pressure as oil continued to plummet along with bank stocks. On Thursday U.S. crude oil closed at a 13-year low only to snap back on Friday gaining over 12%. One of the reasons why oil has bounced off of multi-year lows is a rumor was floating around that the Organization of Petroleum Exporting Countries aka O.P.E.C. was prepared to cut production. We will see if this becomes the case. Furthermore, the European banks have been sold off ruthlessly all year long which has indeed carried over to our banks here at home. So when you have both oil and banks selling off the way that they have, it’s no wonder why there has been a global sell-off sending markets into correction territory.

As the global sell-off continues and as the chatter of doomsday gets louder and louder, I think it is important to remember that we have been in one of the strongest and longest bull markets of all time. Let’s not forget it is not only normal but quite healthy that stocks, bonds and commodities correct and balance out. It amazes me that when sell-offs occur that lead to corrections in the marketplace how the pundits come out of the woodwork and speak to how the world is coming to an end. My friends, what hasn’t been normal is for over six years how we have not had a market correction of over 10% that has stuck. Well here we are today and this is where we find ourselves.

Yes, equities can go lower and yes it can get more painful. But once valuations become attractive again and this is what market corrections provide, you better believe at some point in time buyers will resurface and take advantage of the what goes on sale. The markets are closed on Monday due to Presidents’ Day. Both Paula and I wish everyone a very safe and happy holiday 🙂

~George


Stocks Are In A Tailspin!

After starting the year off in sell mode, stocks are accelerating their declines and are now in correction territory. Yesterday’s rally sparked hope that a short term bottom was put in, however, this is not the case as the Dow Jones Industrial Average (chart) plunged 400 points at today’s open, the Nasdaq (chart) opened lower by over 100 points, the S&P 500 (chart) opened down over 2% and the small-cap Russell 2000 (chart) is now trading below 1000. What gives? First and foremost, China’s Shanghai Composite Index has lost over 20% of its value since late December and is now in a bear market. China’s market fall has indeed spilled over into the global markets. Secondly, crude oil (chart) has continued to decline and is now trading below $30 per bbl spreading fears of widespread bankruptcies in the oil and gas space. These two factors alone have been enough to send our markets into correction mode.

That said, what I try to do in this type of market environment is to place emotions in check and to keep things into perspective. Since this bull market began in 2009, we have not really experienced a market correction. Yes, it has been over six years since we have had a meaningful market decline that has stuck. People tend to forget that market corrections can be a very healthy thing for an overextended market. Investors and traders alike have been spoiled over the past six years by essentially taking their positions and switching on auto-pilot. I believe those days are gone and they should be. When the Federal Reserve took action and began their aggressive monetary policies i.e. buying bonds and placing interest rates at or near zero, stocks took off and did not look back. We have not been in a normalized market environment since then.

Fast forward to today and with essentially no Fed intervention and with a change in interest rate policy, we now have markets trading off of economic and corporate merits. This to me is not a bad thing because now investors can assess the value of the markets as well as individual stocks more accurately and more confidently. This is a concept that most traders and investors have been waiting on and that is to make their investment decisions based off of facts and not what the Federal Reserve will or will not do.

Good luck to all 🙂

~George

Rough Quarter For Stocks…

Although the markets rallied yesterday, the major averages in Q3 closed lower for the second straight month. In fact, year to date the Dow Jones Industrial Average (chart) is down 8.6%, the Nasdaq (chart) is off by 2.5%, the S&P 500 (chart) is lower by 6.8% and the small-cap Russell 2000 (chart) year to date is down 8.6%. So the bulls are asking what gives? My question is more of what has taken so long? The U.S. markets have not seen any kind of meaningful or long lasting correction in six years. This is not a surprise and if anything should be embraced. Stocks have been driven by the Federal Reserve policies ever since the introduction of the first quantitative easing mandate. How easy has this market been? All any investor or fund manager really had to do over the past 6 years is buy and hold with no need for concern. I think it’s safe to say the landscape is changing and rightfully so. There are many investors out there that missed this stunning bull run we have been on simply because it was hard to agree with the valuations that most of the market has enjoyed during the Federal Reserve buyback program and low interest rate stance. Top-line growth has really not been the catalyst that has driven stocks during this incessant bull market. However, when you are in a low to negative interest rate environment there really isn’t any other option to place funds. The question now is are we heading towards or already in a normalized market environment? Meaning will equities now begin to trade on their own merits? To me it certainly feels like the markets are setting up this way.

We won’t have to wait very long because third quarter earnings reporting season is just ahead. Without question I expect this upcoming earnings reporting season will be scrutinized like no other in recent memory. I believe gone are the days that investors will give any company a pass should their results come in under street estimates or even in-line with the street. For me personally there is too much volatility in the marketplace right now and my preference is to go to the sidelines until after Q3 earnings reporting season is over. I will then evaluate the landscape from a fundamental and technical point of view. Speaking of the technical shape of the market, this too of a concern of mine. All of the key indices are in a significant down trend trading well below their respective 200-day moving averages. Yes theses indexes are finding a bit of support right here, but if earnings reporting season doesn’t add up, new 52 week or even multi-year lows could be in the cards? My point here is that with the way the markets look and feel, it is probably best to be a bit more conservative until after we see the health and growth rate of corporate America. Good luck to all 🙂

~George