A Mixed Month For Stocks…

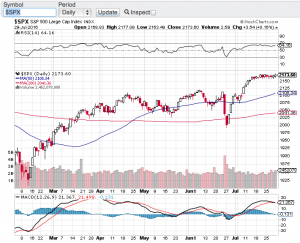
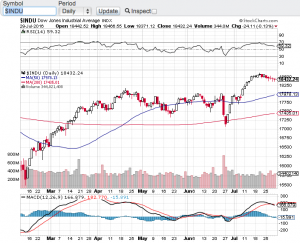
The month of May was a mixed month for stocks and the major averages. The Dow Jones Industrial Average closed out the month down 3.5% (see chart here) while the S&P 500 (see chart here) and the Nasdaq Composite closed the month out in the green. The small-cap Russell 2000 (see chart here) like the Dow closed the month out lower. Not bad considering how the debt ceiling issue and debate has been in the news seemingly hourly as everyone waits with bated breath as to what Congress will do. To me I wonder why this drama about raising the debt ceiling so the government can pay its debt and obligations is always a thing? Why even have a debt ceiling when there is no way United States of America could ever default on its debts and obligations. If this was to occur a global meltdown like never before seen could occur. How about this concept? No debt ceiling at all and instead vote in a fiscally responsible administration and politicians to manage our country’s finances properly. Sounds simple enough, but who am I kidding. Ok, enough of this and back to the markets.

Despite being an historically softer month for the stock market, May did not perform too bad as evidenced above. Yes, a mixed bag, but I think investors are happy to see that we didn’t fall off a cliff. That being said, as a look at the technical shape of the aforementioned indexes what is standing out to me is how key support lines are in play. The Dow Jones Industrial Average (chart) is hovering right around its 200-day moving average, while the S&P 500 (chart) is currently being supported by its 20-day moving average. The Nasdaq Composite (chart) is trading nicely above it’s 20, 50 and 200-day moving averages while the small-cap Russell 2000 (chart) is bouncing around its 20-day MA.

Lastly, I think the markets are in a position to continue its recent trading patterns and as soon as the final vote comes in on the debt ceiling matter, everyone will breathe a sigh of relief.

Good luck to all 🙂

George

Is It Time For A Breather?

Stocks have been on a tear since the end of June with the key averages gaining close to 10% or more since coming off of their late June lows. That’s right double digit gains in a little over a month lead by the Nasdaq (chart) which is almost up 13%, followed by the small-cap Russell 2000 (chart) up 12.35% and both the S&P 500 (see chart below) and the Dow Jones Industrial Average (see chart below) closing up nearly 10% in that same time period. Part of the reason why the tech focused Nasdaq has led the charge is the stronger than expected and recently announced quarterly earnings results out of Amazon (NasdaqGS: AMZN) Apple (NasdaqGS: AAPL), Facebook (NasdaqGS: FB) and Google aka Alphabet (NasdaqGS: GOOGL).

So the question now is after such dramatic double digit gains in the aforementioned indices and in such a short period of time, is it time for a pause and/or a retracement? As you all know by now, the first thing that I look at when it comes to accelerated gains in any stock or index is the relative strength index also known as the RSI. The relative strength index is a technical indicator to determine overbought or oversold conditions, click here  for the complete definition. The RSI is also one of the favorite technical indicators used by market technicians, certain money managers and even select algorithms have the RSI programmed into their model. That said, the Nasdaq has now hit the 70 value level of the RSI which is an overbought level according to the RSI while the other key indices are not too far behind. Please note that indexes and stocks can remain overbought for extended periods of time.

So what does all of this mean? Well I think the set-up now is a little spooky. Not only are we at or approaching overbought conditions according to the relative strength index, but we now find ourselves in the month of August. August historically tends to be one of weakest month of the year for equities. In fact, over the past seven years the key indexes have fallen each year during this time period. History doesn’t always have to repeat itself, but the current set-up bodes well for a softer month ahead. We will see. Good luck to all 🙂

~George

S&P 500 George Mahfouz Jr

Dow Jones Chart George Mahfouz Jr

Finally The Bulls And Bears Got What They Wanted!

A Correction! After years of not having a 10% or more correction in the markets and with August tending to be one of the worst performing months for equities, this was the perfect set-up for the long overdue correction in stocks to take place. However, just as fast as the stock market correction occurred, the ensuing snap back rally was equally eye-poping. For the month, the Dow Jones Industrial Average (chart) fell 6.57%, the tech focused Nasdaq (chart) lost 6.86%, the S&P 500 (chart) -6.26% and in the month of August the small-cap Russell 2000 (chart) experienced a 6.45% decline. Last week we did witness very rare market behavior with whipsaw action not seen since the 2008 financial market crisis. This brought back memories of how stocks and financial markets can irrationally behave as emotions and high frequency trading take over.

The question now is, is this type of market volatility over? I don’t think so. Let’s first take a gander of the technical health of the four major averages. Without question, short term technical damage in these key indices have occurred. Each one of the index have fallen sharply and have closed below their respective 200-day moving averages. Furthermore, today at the open and for the first time in years, the S&P 500 (chart) will have its 50-day moving average crossover its 200-day moving average. Technically and historically speaking, this is not usually a good thing. The Dow Jones Industrial Average (chart) saw its 50-day crossover its 200-day in the middle of August only to experience exhaustive selling thereafter. The good news technically is that stocks had been way oversold to the point 0f capitulation. Hence, the ensuing sharp rally from the most recent lows.

So where do we go from here? I suspect that we will continue to experience outsized market moves in both directions and trading this kind of market environment is not for the feint of heart. I revert back to a more conservative approach starting with identifying the most current “best of breed” in their respective industries. The first prerequisite for me in identifying potential investment candidates in this type of market environment is for companies to have pristine balance sheets with little to no debt levels. However, if they do have debt they must have have historic and current cash flows that can easily service their debt. Without this and in today’s market I have no interest on really owning anything. Of course there are many other metrics that do apply but for me personally the balance sheet is where it begins. Another huge factor for me especially today is to implement disciplined  “protective stops” in any positions I hold. This ensures that your portfolio is somewhat protected should the markets decide that we are in the early innings of this correction. With that said and especially in today’s market, please consider consulting with a trusted certified financial planner(s) before making any additions or modifications to your own portfolio.

Both Paula and I wish everyone a very safe and Happy Labor Day holiday weekend 🙂

~George


Despite A Pop In Volatility, Bull Market Remains Intact!

In the month of July, the major averages continued to demonstrate what a bull market looks like despite an increase in volatility $VIX (chart )and global macro concerns. For the month, the Dow Jones Industrial Average (chart) closed up a modest 0.40%, the Nasdaq (chart) gained 2.8% in July, the S&P 500 (chart) advanced 2.0% and the small-cap Russell 2000 (chart) actually ticked down on the month giving up 1.28%. One interesting note and if you look at the charts of the above mentioned indices, in the month of July each of these indexes breached their 200-day moving average and three of the four breached this support line twice only to rebound sharply and keep the technical makeup of the markets intact. Without question and throughout this six year long bull run, the technicals of stocks and indexes have done their job and has acted as technicians would expect.

Fast forward to today August 1st and if you have been on Wall Street long enough, yes we are now entering the dog days of summer. As Q2 earnings reporting season works its way through and begins to wind down, I would expect volatility also begin to abate as it has towards the latter part of this past week. Without question these markets could still react to China’s extreme volatility as of late or if there is a big surprise in next week’s job’s report, however, without any big surprise here or overseas, I think this becomes a stock-pickers market as well as a technically traded market paying attention to trend lines and overbought and oversold conditions. This could also be the perfect environment to sell put option premium on your most favorite stocks in order to generate some additional income. One other option which may be a very valid one, and that is turn off your screens and head to the beach until after Labor Day :-).

Whatever you choose to do as we enter the “dogs days of summer” it is always best practice to consult with a certified financial planner(s) before making any investment decisions or changes to your portfolio. Good luck to all 🙂

~George

Late April Sell-Off Wakes Up The Bears…

Stocks sold off sharply on the last trading day of April. The Dow Jones Industrial Average (chart) fell 195 points, the Nasdaq (chart) closed down 82.22 points, the S&P 500 (chart) lost 21.34 points and the small-cap Russell 2000 (chart) finished lower by 26.83 points. The biotech sector has lead the charge in this most recent selloff with the most popular biotech ETF (Symbol: IBB) (chart) losing over 10 percent of its value since mid-March. Another factor in this sell-off is the sloppy earnings reporting season we find ourselves in. Just this week both Twitter (NYSE: TWTR) and Linkedin (NYSE: LNKD) surprised the street with their weak quarterly results and even weaker forward guidance. So the selling pressure is not just in the biotech space, it has now spilt over to the technology sector as a whole. That said, this morning there may be a bit of a respite with the futures market pointing up sharply.

Let’s take a look at the technical shape of the markets as we now enter into May. One troubling sign is the four major averages mentioned above have all breached their 50-day moving average line, with the small-cap Russell 2000 falling prominently below it. Let’s see if these key indices remain below this popular technical indicator for more than a few days. A one day breach does not necessarily mean a total technical breakdown however, another slight concern of mine is that these averages are not oversold yet according to the relative strength index or the RSI. Click here for the definition of the RSI. Now take a look at the charts of the Dow (chart), Nasdaq (chart), S&P 500 (chart) and the Russell 2000 (chart) and you will see at the very top of the chart the plot of the relative strength index and you will further see that these indexes have more room to go to reach the 30 value level of the RSI, which is the level that qualifies an oversold condition. Now throw into the mix that May is historically a weak month for equities and we indeed be in for some additional selling pressure.

In closing, I will re-visit the technical make-up of the markets in mid-May and see where there could be some buying opportunities. Good luck to all 🙂

~George

Now That’s What I Call A Bounce!

After such a torrid bull run in 2013, where the the four major averages gained over 25%, to no great surprise, these same indexes experienced more than a 5% pullback in January and early February. However, over the past couple of weeks and true to form, these indexes not only bounced off of key technical support zones, but they also took back their 50-day moving averages. For the week, the Dow Jones Industrial Average (chart) finished up 2.28%, the Nasdaq (chart) had a gain of 2.86%, the S&P 500 (chart) +2.32% and the small-cap Russell 2000 (chart) closed the week up 2.92%. The markets responded with a roar as the new Fed chairwomen Janet Yellen, in her first public appearance at the helm of the Fed, reiterated her commitment to model after the Bernanke era monetary policies. Stocks were already recovering from the January correction but accelerated their gains as she spoke to Congress this past Tuesday. All expectations now are that stocks will remain buoyed by the continuing asset backed purchases despite the modest tapering that is now in effect.

In my previous blog I expressed concern over the technical breakdown of the markets and that the 50-day moving averages of the key indices had been breached. Furthermore, I thought there was a possibility of the 200-day being the next stop. However, I did also indicate that if the markets were able to rebound and take back their 50-day and remain above that mark, that would be a positive. This is where we find ourselves now. All of the aforementioned key indexes have traded and closed above this key technical metric. The question now becomes whether or not this slingshot bounce and break above the 50-day is sustainable? Q4 earnings reporting season really didn’t say too much about the growth of corporate America, which overall was a mixed bag at best for the majority of the sectors. Couple this with economic signs of weakness as retail sales growth still remains flatlined, and I think we will continue to experience choppy waters for stocks, and I would be surprised if we began making new high after new high like last year. That said, liquidity for stocks is seemingly plentiful and we are still in a strong seasonality period for equities, so I also wouldn’t be surprised if we stabilized above the 50-day and consolidated for an extended period of time. Unless of course there is an unexpected negative geopolitical or global macro event that creeps back into the mix, then all bets are off. I will continue to track the technicals to gauge entry and exit points while using protective stops along the way. Good luck to all and both Paula and I wish everyone a very safe and happy Presidents’ Day holiday. Please note the markets are closed on Monday in recognition of Presidents’ Day.

Have a great weekend 🙂

~George