Upward Trend Remains Intact!

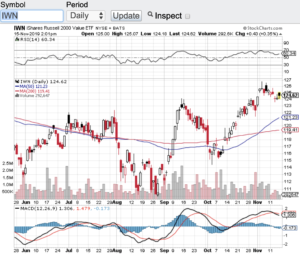
Record highs continue as the upward trend in the stock market remains intact! Despite the impeachment proceedings now going public and despite the China trade deal seemingly pausing we are still setting records. The Dow Jones Industrial Average (see chart here), the S&P 500 (see chart here) and the Nasdaq Composite (see chart here) all hit record highs this week. The small-cap Russell 2000 (see chart below) is holding its own in the overall upward trend, however, this index remains below its all-time high by 150 points or so.

The good news today coming out of the White House is that we are getting closer to a deal with China. This news was enough to send the Dow Jones Industrial Average (chart), the S&P 500 (chart) and the Nasdaq Composite (chart) to all time highs yet again. It is incredible that just a blurb out of the White House regarding a potential deal sends stocks rip roaring ahead. One of the concerns I have about actually seeing a deal get done by year-end is that next week it is possible a tweet from our President may read the exact opposite. If you look back and think about it how many times have we seen a tweet or an announcement that a deal is getting closer only to have the next statement speak to the exact  opposite. Hopefully today’s announcement (click here) sticks and that we actually see a trade deal get done by year-end. No more talk!

If indeed a trade deal gets done there no question this will be good for business here in the U.S. Although it may feel that stocks and the key indexes are overbought, if a deal gets done then it is very possible that we continue to notch records between now and year-end.

Good luck to all 🙂

~George
The Uptrend Remains Intact - George Mahfouz

Strong Economy Equals A Strong Stock Market!

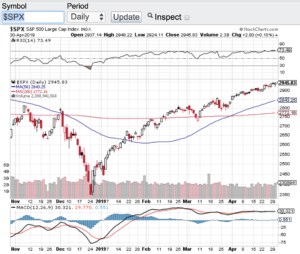
The economy posted a 3.2% gain in the first quarter and as the saying goes, a strong economy equals a strong stock market! Is it any wonder as to why the Nasdaq Composite (see chart here) hit an all-time high on Monday! The same rings true with the S&P 500 (see chart below). The S&P 500 hit an all-time high on Monday as well. Now the Dow Jones Industrial Average (see chart here) has a bit more work to do in order to tap its own record as does the small-cap Russell 2000 (see chart here). However, I am sure the bulls will take 2 out of the 4 major averages setting all time highs. What is also helping the stock market is how the Federal Reserve has taken a cautious approach to raising rates any further. In fact, there are calls out of Washington DC asking the Fed to start lowering rates to stimulate the economy even further. Now I am not so sure that the Fed will accommodate Washington’s request, but I do think it is safe to say that we should not see a rate hike in the near future or maybe not at all for the rest of this year.

One note of caution to me is that with nearly half of corporate America reporting their Q1 earnings so far, we are seeing on average a year over year decline in earnings. There are still 100’s of companies set to report over the coming weeks but if this trend continues, this will be the first year over year decline in corporate earnings in years. I will be keeping an eye on this development.

The technical shape of the aforementioned indexes remain intact. The Dow, Nasdaq, S&P 500 and the Russell 2000 all are trading above their respective key moving averages. However, both the Nasdaq Composite (see chart here) and the S&P 500 (see chart here) have entered into overbought territory according to the relative strength index also know as the RSI. That said, I would not be surprised to see at the very least some consolidation or an outright healthy pullback. Good luck to all 🙂

~George

S&P 500 - Paula Mahfouz

Bellwether Indexes Surge To All Time Highs!

Bellwether indexes surge to all time highs as the S&P 500 (chart) closed the month of August at 2901, the Nasdaq Composite (chart) closed at 8109, the small-cap Russell 2000 (chart) closed at 1740 and the Dow Jones Industrial Average (chart) is within striking distance of its all time high. I thought August is supposed to be a tough month for stocks? Not this year! New highs are happening while the political environment in our country is at a seemingly all-time low, the word impeachment surfaces daily now, tariffs are in the headlines daily, interest rates have been on the rise and now it seems that any type of progress made over the summer with North Korea may be in jeopardy. One would think that the aforementioned risks would be enough for an outright 10-20 percent market correction. Add in the seasonality factor and we should indeed be going red, not making all-time highs.

Now I am afraid to even mention that the month of September is historically the weakest month of the year for stocks right alongside with August. Do I dare say that September will be the month that our markets correct in a meaningful way? Do I have the courage to predict that this will be the month where the markets recognize and adjust for all of the risks that are present in our current environment? I don’t know people, I am as baffled as the next guy as to how these markets keep shrugging off real market issues. Oh by the way I forgot to mention we have mid-term elections forthcoming, the markets are not pricing in any risk there either. These markets are priced and acting like there is no absolute risks at all out there. Ok enough banter already!

How to play the markets now? I am a fan of the old adage “the trend is your friend” but folks I just can’t hop on this train at this point in time. I am heading to the sidelines until I see any type of technical breakdown to possibly consider implementing a short thesis or just wait for the inevitable pullback/sell-off to identify any potential long set-ups. Until then, Paula and I wish everyone a very safe and Happy Labor Day weekend 🙂

~George

Despite A Pop In Volatility, Bull Market Remains Intact!

In the month of July, the major averages continued to demonstrate what a bull market looks like despite an increase in volatility $VIX (chart )and global macro concerns. For the month, the Dow Jones Industrial Average (chart) closed up a modest 0.40%, the Nasdaq (chart) gained 2.8% in July, the S&P 500 (chart) advanced 2.0% and the small-cap Russell 2000 (chart) actually ticked down on the month giving up 1.28%. One interesting note and if you look at the charts of the above mentioned indices, in the month of July each of these indexes breached their 200-day moving average and three of the four breached this support line twice only to rebound sharply and keep the technical makeup of the markets intact. Without question and throughout this six year long bull run, the technicals of stocks and indexes have done their job and has acted as technicians would expect.

Fast forward to today August 1st and if you have been on Wall Street long enough, yes we are now entering the dog days of summer. As Q2 earnings reporting season works its way through and begins to wind down, I would expect volatility also begin to abate as it has towards the latter part of this past week. Without question these markets could still react to China’s extreme volatility as of late or if there is a big surprise in next week’s job’s report, however, without any big surprise here or overseas, I think this becomes a stock-pickers market as well as a technically traded market paying attention to trend lines and overbought and oversold conditions. This could also be the perfect environment to sell put option premium on your most favorite stocks in order to generate some additional income. One other option which may be a very valid one, and that is turn off your screens and head to the beach until after Labor Day :-).

Whatever you choose to do as we enter the “dogs days of summer” it is always best practice to consult with a certified financial planner(s) before making any investment decisions or changes to your portfolio. Good luck to all 🙂

~George

Record Closing High For The S&P 500!

Despite choppy trading for most of the week and weak economic data being released, the S&P 500 (chart) closed the week out at a record closing high of 2122.73. The Dow Jones Industrial Average (chart) is now only a mere 16 points away from its all-time high of 18,288.63, the Nasdaq (chart) appears to be closing in on its record high of 5119.83 and the small-cap Russell 2000 (chart) is attempting to claw its way back to record territory.

I thought you were supposed to “sell in May” and go away? Apparently not! However, I will say this, these records that are occurring are happening on lighter volume than I would want to see to validate the most recent price action. Nonetheless, you cannot deny the incessant strength that the markets are showing. Not less than two weeks ago it appeared that we might of been en route to the 10% correction or so that had been chattered up by the pundits. In early May, the S&P 500 (chart) had breached its 50-day moving average only to snap back and set a new record closing high yesterday.

Speaking of the moving averages, the aforementioned key indices are now comfortably trading above their 50-day moving averages with the exception of the small-cap Russell 2000 (chart). The Russell yesterday did closed right at its 50-day. We will see next week if this index can join the other major averages and reclaim its 50-day moving average and close in on its record high. Now let’s take a look at the Relative Strength Index which another favorite technical indicator of mine. The RSI is a technical indictor that demonstrates whether or not a index or stock is oversold or overbought, click here for the complete definition of the RSI. Even though we are at record highs, none of the major averages are in overbought territory according to the RSI. Add to the mix that next week will lead up to Memorial Day weekend and volumes should begin to decrease, I do not see any major catalyst that would interfere with the most recent upward trend of the market.

Speaking of Memorial Day, both Paula and I wish everyone an upcoming safe Memorial Day holiday weekend and let’s not ever forget all who had bravely served our country.

~George

Finally Congress Gets a Deal Done!

After 16 days of a partial government shutdown, Congress finally came to terms to reopen the government and raise the debt ceiling. Talk about waiting until the last minute! Needless to say, stocks over the past couple of weeks have experienced an increase in volatility with triple digit gains and losses during the shutdown. Despite the turmoil in Washington, the Dow Jones Industrial Average (chart) on Wednesday closed up over 200 points, the Nasdaq (chart) managed to close at a 13 year high, the S&P 500 (chart) is nearing its all time high and the small-cap Russell 2000 (chart) finished the trading day at an all time record. Now the street can focus on Q3 earnings reporting season and so far, not so good.

After the close yesterday, bellwether International Business Machines (NYSE: IBM) shocked the street by missing revenues by almost $1 billion dollars and is down nearly seven percent in pre-market trading. Also after the close yesterday, Ebay (NasdaqGS: EBAY) reported in-line revenues, however guided lower for the upcoming holiday season. With Q3 earnings reporting season kicking into to high gear, I am questioning whether or not this will become the trend for the quarter? Most analysts do not expect this to be a robust quarter for corporate America, so now the question becomes does the imminent pullback in stocks become a buying opportunity before year end? Quite frankly with the headline risk out of Washington seemingly over for now, I beleive that the trend of pullbacks being bought will continue between now and year-end. I will look at key technical support levels for possible entries, and on the S&P 500 (chart) the 1680 zone appears to be the first level of support, which also happens to be its 50-day moving average, followed by the 1620 area. What gives me this vote of confidence of a continuing bull market into year-end is not necessarily how corporate earnings will fair, but the fact that the Federal Reserve continues to promise that it will do whatever it takes to support the economy, hence the bull market should continue. That said, when the Federal Reserve begins to taper, this will be the time that corporate America will truly need demonstrate top-line growth. In closing, no matter how your portfolio is positioned, it is usually the best practice to implement some type of protective stop initiative and of course always consult with a certified financial professional(s) while considering any investment strategy. Good luck to all. 🙂

~George