Stocks In Whipsaw Action!

Volatility makes a comeback as stocks get whipsawed to end the month. The Dow Jones Industrial Average (chart) closed out the month of February with a 380 point loss, the S&P 500 (chart) retraced 30 points, the Nasdaq Composite (chart) dropped 57 points and the small-cap Russell 2000 (chart) closed the last day of February down 24 points. This two-day pull back comes off the heals of a sharp V shape bounce from the market correction that occurred in early February. During the bounce off of the most recent bottom it sure started to feel like the good ole days of lower vol and melt up mode. Not this time and at least not yet. What was abnormal was how volatility was virtually non existent over the past few years. Seemingly passive investing was the only place to be and in hindsight that was indeed the only place to be. During the multi-year melt-up we watched hedge funds underperform and in some instances close shop. There was simply no volatility for hedge funds hedge. It was a one way ticket up.

So what has changed you may ask? I think it is safe to say that the shift in the Federal Reserve’s policy albeit a delicate one is as far as you have to look. Since the financial crisis of 2008, the Federal Reserve has provided its entire war chest of financial accommodation to get the economy and banking system not only of its feet, but thriving again. So now that all systems are a go the Fed is unwinding its balance sheet and raising interest rates. Yes that sounds like a pretty simple answer but it’s also pretty clear to see. With that being said, I do not expect the Federal Reserve to act too quickly unless inflation abruptly takes off. In the meantime I believe volatility will be remain prominent in the marketplace which is putting a smile on traders faces and creating opportunity both long and short. πŸ™‚ Good luck to all!

~George

New Year, New Records?

Happy New Year! Will 2018 be a new year of new records? Nothing would surprise me. Especially as the Dow Jones Industrial Average (chart), the S&P 500 (chart), the Nasdaq (chart) and the small-cap Russell 2000 (chart) shattered record after record after record in 2017. In fact the Dow Jones Industrial Average set 70 record closing highs in 2017. That’s not a typo folks, 70 record closing highs. The other aforementioned key indices also set multiple record highs throughout last year. So could we see a repeat performance in 2018? I don’t know about another 70 record highs this year but I would not be surprised to see continuing strength in the markets in 2018. Yes the Federal Reserve is now in a rate hike mode which typically does not bode well for stocks, but this Fed and central banks from around the world understand the need to go about their new rate hike policies in a gradual manner. Raising rates too aggressively could be the exact catalyst to put the brakes on this almost decade long bull market. I don’t think this will be the case at least with our own Federal Reserve. Jerome Powell will be replacing Janet Yellen in early February as our new Federal Reserve Chairman. Mr. Powell who has been a member of the Federal Reserve’s board of governors since 2012 has voted for keeping interest rates at bay while the economy continues to recover.

Speaking of the economy, expansion continues to occur and we will soon find out how our economy isΒ  trickling down into corporate America. Fourth quarter earnings reporting season will begin here in January and this could very well serve as a key catalyst for the continuation of the bull market. That said, I think most investors and traders are looking for the markets to pause and pullback from this historic run we continue to be on. It is truly breathtaking to witness the record pace that stocks have enjoyed for years now. Personally, I hope and some point in time we do get a meaningful pullback so we can have the opportunity to step in at lower prices. Good luck to all and Paula and I wish everyone the healthiest and happiest new year! πŸ™‚

~George

Big Time For Big Tech!

Large cap tech stocks have taken center stage this earnings reporting season big time! Absolute blowout earnings reports came in from Amazon (NasdaqGS: AMZN), the parent company of Google, Alphabet (NasdaqGS: GOOGL) and the elders of the group Intel Corp (NasdaqGS: INTC) and Microsoft (NasdaqGS: MSFT). These tech titans are the latest reason for the Nasdaq (chart) and S&P 500 (chart) to reach and close at record highs yet again. The Dow Jones Industrial Average (chart) and the small-cap Russell 2000 (chart) are also within striking distance of their all times highs. Market observers have attributed the strength in stocks this year to a continuing low interest rate environment and the upcoming new tax policy from the Trump administration. This I get, however, no one can deny the growth that is happening in the tech world as well as other sectors of the economy.

The one note of caution I have here is the exuberant environment we find ourselves in with record highs happening weekly and in some instances daily. Yes earnings reporting season so far has been stellar but let’s not forget that we have not seen price to earnings ratios this elevated in quite some time. The question that now comes to mind are the markets and the aforementioned stocks finally at fair value? Especially as the p/e’s increase and as we approach a much higher interest rate environment over the next two years. We have been in such an accommodative monetary state for almost a decade which without a doubt has been the catalyst for equities and indexes and now the federal reserve here in the U.S. is reversing course. One of the groups that get the most affected in a higher interest rate environment are growths stocks like the aforementioned tech titans.

I am not suggesting that these stocks will not continue their upward trajectory, but I am making note and will be paying closer attention to the overall price to earnings ratios of the indexes and of high growth stocks in general as p/e’s continue to elevate. Good luck to all πŸ™‚

~George

Is It Time To Hedge?

As we remain in one of the strongest bull markets ever, is it time to hedge? Whoever has tried to short the market this year or for that matter the last nine years understands this has not been an effective strategy to say the least. However, as we are now entering the height Q3 earnings reporting season and as I mentioned in my previous blog implementing a hedge strategy could provide continuing beta should the bull market carry on yet offer profits in the event stocks or indexes go down. The strategy I am referring to is an options strategy called a “straddle”. A straddle is when an investor buys a call and a put option with the same strike price and expiration date with the selected strike price as close as possible to the current stock price of the underlying asset. Let’s take Intel as an example: Intel (NasdaqGS: INTC) closed on Friday at $39.67 and is scheduled report their earnings results on October 25th. Taking a look at the November $40 strike price on Intel, the call option is approximate $0.83 per contract and the put option is approximately $1.34 per contract. So if an investor/trader decides to put a straddle on Intel at this particular strike price, the total cost of the straddle is $2.17. You arrive at this number by simply adding up the cost of the put and call option. Where you profit from this trade is if Intel trades north or south of $40 by more than the total cost of the trade and before expiration.

One of the reasons why straddles can be effective during earnings reporting season is that earnings can be a huge catalyst for stock price movement. This especially rings true when a company surprises to the up or downside. With a straddle it does not matter which direction the underlying asset moves, so long at it moves greater than the total cost of the straddle. The risk with the straddle is if the underlying asset does not have a big move in either direction before the straddle expires. Options do have an expiration date so you have to make sure that the catalyst occurs before the expiration date and even then allow yourself time for the full potential to play out. I also look for the historic movement of a stock or index to see if it does move greater than the cost of any given straddle regardless of a “catalyst”. That said, options and options strategies are extremely risky and volatile and you should always consult with a certified financial planner before considering any new strategy. Good luck to all πŸ™‚

~George

Russell 2000 – All Time High!

So now the small-caps join in! The Russell 2000 (chart) closed the week at an all time record high of 1490. For most of the year the widely followed small-cap Russell 2000 has lagged the other major averages. Now it has broken out, see (chart). In fact, when you look at the chart of the Russell, one can say this index has gone parabolic. The Nasdaq (chart) and the S&P 500 (chart) also closed at their all time highs on Friday, while the Dow Jones Industrial Average (chart) posted yet another positive week. What’s more is the month of September is typically one of the weakest months of the year for equities losing on average of 1.5% happening 70% of the time since the 1970’s. Not this year, in fact there have been so many record-breaking closes on all of the aforementioned indices it’s hard to keep track.

Question is, now what? With the third quarter of the year now in the books, Q3 earnings reporting season is right around the corner. I have got to believe with the Federal Reserve closing the chapter on their quantitative easing policy and now taking those assets off of their books, plus interest rates scheduled to rise, investors should pay closer attention to the health and growth of corporate earnings. Do you remember the days when earnings and earnings growth actually mattered? Well those days may be back upon us. Hence, the report cards that come in from corporate America may actually move the markets in a fundamental way. This we have not seen in almost a decade. However, if the market momentum that we have experienced since the election continues, and investors ignore the fundamentals, then why couldn’t we end the year at even higher highs?

One thing for sure is October will be filled with many catalysts that should bring in some volatility and a lot of opportunity.Β  Between now and year end may be the time to implement a hedged strategy where one can potentially profit regardless of how the indexes or individual stocks react to what’s ahead. I’ll cover this in my next blog. Good luck to all. πŸ™‚

~George

The Bears Are Baffled!

What is historically one of the weakest months of the year for stocks, the S&P 500 (chart) closed the week and halfway point of the month at an all time high of 2500. The Dow Jones Industrial Average (chart) also closed the week at a record high, along with the tech-focused Nasdaq (chart) and last but not least, the small-cap Russell 2000 (chart) appears to be closing in on a new record high as well.

The bear camp has to be completely exhausted. I mean how in the world can you have the confidence to short this market? Not even the continuation of North Korea’s missile launches can slow down one of the most significant bull markets in history. Now seemingly we need to throw out all traditional metrics, seasonalities, geo-political risks, price to earnings ratios etc. This market has been immune to any risks. I have never seen anything like this. What’s more, there are survey’s out there that indicate that professional investors are the most pessimistic about the markets since before the election. You know what that means? Stocks tend to act the opposite of street sentiment.

Over the years and as most of you know one of my favorite technical indicators and one of the preferred technical indicators of money managers and institutional trader alike is the relative strength indicator. This indicator has been a trusted source to spot overbought and for that matter oversold conditions. The problem I have encountered this year is when indexes or individual equities have reached an overbought condition according to the RSI, the pullbacks that ensue have not provided the proper risk reward to any short thesis. The retracements are so shallow and short-lived that it is not worth putting the trade on. So needless to say, this strategy is on hold for now.

I am not sure what will be the catalyst for stocks or indexes to begin trading on pure fundamentals and not on the oversupply of liquidity and low interest rates. Until then, I will be very cautious in using the traditional metrics and/or technical indicators to base my decisions off of. Good luck to all πŸ™‚

~George

Is Gold Breaking Out?

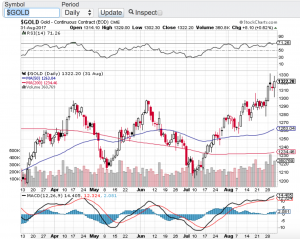
It certainly appears that way. Gold (see chart below) has caught a meaning bid as of late and it’s about time. The yellow medal has been stuck in a trading range between $1200 and $1300 per ounce for months and now has broke through the $1300 level currently trading around $1330 per ounce. What has surprised me is how long it took for gold to finally go from the left side of the chart to the right. Especially considering the geopolitical risk environment we find ourselves in. That said, stocks are saying what risk? As I write this blog, the Dow Jones Industrial Average (chart), the S&P 500 (chart), the Nasdaq (chart) and the small-cap Russell 2000 (chart) once again are all approaching all time highs. This after a very modest pullback in August. So Wall Street continues to remain in the “buy the dip” mood. All year long and every single time stocks experience any type of pullback, buyers come in and lift the markets to all time highs.

How long can this last? From a technical standpoint the key indices remain below the 70 value level of the relative strength index also referred to as the RSI. The RSI is used as a gauge by certain market technicians to see if whether or not stocks in the short term are overbought or oversold. As as these indexes approach all-time highs and should they breakthrough those highs, these markets can and should continue to go higher. However, if they do not breakout here, then one could expect yet another pullback especially as we are now in one of the more underperforming months for equites of the year. Historically September and October for that matter tends to be a difficult time for the markets. However, based on what we have witnessed all year long despite the ongoing geopolitical risks and with interest rates on the rise, the markets may not care about the seasonality trends of September and October. Good luck to all and both Paula and I wish everyone a safe and relaxing Labor Day Weekend πŸ™‚

~George

Gold chart - Paula Mahfouz

2 Percent – That’s It?

What should of been at least a 5-10% correction last week, the major averages barely flinched. This despite North Korea incessant threats of a nuclear attack against the U.S. and President Trump’s response that “fire and fury” will be unleashed by the U.S. in such an event. I am truly in disbelief that the markets did not take this geopolitical risk to correct in a more meaningful manner. In fact stocks yesterday had their best single day of the summer. Now we find ourselves yet again near all time highs. The Dow Jones Industrial Average (chart) closed just shy of 22,000, the S&P 500 (chart) is just under its all-time high of 2490, the Nasdaq (chart) closed at 6430 and the small-cap Russell 2000 (chart) closed Monday’s session at the 1395 level.

Talk about passive, machine driving algorithmic trading. One thing that really stands out to me is how the S&P 500 (chart), Nasdaq (chart) and the Russell 2000 (chart) all held their major moving average support lines. In particular the S&P and Nasdaq’s 50-day MA and take a look how powerful the Russell 2000’s 200-day moving average held and bounced (chart). It is clear that program trading models worked to perfection on this recent market pullback at least pertaining to key technical support levels.

So are we out of the woods pertaining to the risk trade? I am not so sure. But my goodness how can anyone have any kind of short thesis on these markets. Not even the heightened and continuing threat of a nuclear attack can rattle these markets more than 2 percent. Now that the rhetoric coming out of North Korea has abated for now, it could be business as usual as traders and investors get back to focusing on corporate earnings and fed policy. Whatever the case is I continue to be baffled by the strength of the U.S. stock market and without a doubt the old adage “don’t fight the tape” couldn’t be more true this year.

Good luck to all πŸ™‚

~George

Dow 22,000 In Sight…

The Dow Jones Industrial Average (chart) closed the month of July at a record high and came within 70 points of the 22,000 mark. Just a few short months ago that the Dow surpassed the 21,000 milestone. What an incredible run in such a short period of time! Not only is the Dow Jones Industrial Average (chart) notching new record highs almost daily, the Nasdaq (chart) last Thursday posted a new record at 6460, as did the S&P 500 (chart) setting a new record of 2484. Last but not least, the small-cap Russell 2000 (chart) also set a new record last week of 1452. However, both the Nasdaq (chart) and the small-cap Russell 2000 (chart) have reversed their upward trajectory over the last few trading sessions in a noticeable manner. Let’s keep an eye on this development.

I think it is safe to say that Q2 earnings reporting season has helped fuel the Dow Jones to new record highs as well as the S&P 500. Tech stocks have been reporting a mixed bag so far this earnings reporting season which is why that index has started to abate a bit. All eyes today are on Apple (NasdaqGS: AAPL) which report their earnings results after the close. This could be the one stock that either reverses the latest mini-downward trend in the Nasdaq or for that matter, accelerate it. As I look to the technical shape of the the aforementioned indexes, only the Dow Jones Industrial Average (chart) is on overbought territory, while the S&P 500 (chart), Nasdaq (chart) and the small-cap Russell 2000 (chart) have begun their reversion to the mean and are all approaching the 50 value level of the relative strength index.

Game plan for August? Personally, I think it is time to reduce long exposure to equities due in part to this startling run stocks have had all year long. This coupled with the month of August being an historically weak month for equities could create the perfect set up for the much anticipated market correction that the bears have been waiting on. That said, I have to remind myself that there has been no such thing as typical in these markets for we have been in unchartered territory for a long period of time. One final note, it is always recommended to consult with a certified financial planner before making any adjustments to your portfolio.

Good luck to all πŸ™‚

~George


Where Is The Vol?

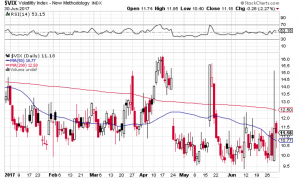
As the second quarter came to a close yesterday volatility is no where to be found. The CBOE Market Volatility Index also referred to as the VIX has been pretty much dormant this entire year (chart). Typically vol ticks up as we approach summer for a variety of reasons such as earnings reporting season, seasonality and of course the Federal Reserve policy actions. As expected the Fed did raise rates in June but the markets appear to be pricing in a higher interest rate environment. So far this year the Dow Jones Industrial Average (chart) is up 8.03%, the S&P 500 (chart) is up 8.24%, the Nasdaq Composite (chart) is up a whopping 14% and the small-cap Russell 2000 (chart) is up a modest 4.29%.

Seemingly everyday stocks are in melt-up mode. There are days where volatility tries to rear its head up, but that does not last very long. (See chart below). Even when Goldman Sachs came out with a bearish report on June 9th comparing the red-hot tech sector to the internet bubble era, the negative effect of that report lasted only a couple of days before tech found support and then proceeded to make new highs. The traders and investors that are waiting for the proverbial 10% or more correction are just not getting it. Buying the pullbacks is what has been working ever since the election but the problem is that if you are not stepping in on the 1-3% percent retracements, you are missing the next leg up. How much longer can this type of market environment last? Now that Q2 is in the books, earnings reporting season will soon begin. Let’s see if corporate earnings continue to come in stronger than analyst expectations and if so, stocks may just continue to remain bulletproof.

A quick gander at the technical shape of the aforementioned indexes and there are no signs of overbought or oversold conditions according the relative strength index. Therefore I am expecting vol to remain relatively low until at least second quarter earnings season begins. Good luck to all!

Both Paula and I wish everyone a very safe and happy Fourth of July holiday weekend πŸ™‚

~George

VIX Chart - Paula Mahfouz