New Year, New Records?

Happy New Year! Will 2018 be a new year of new records? Nothing would surprise me. Especially as the Dow Jones Industrial Average (chart), the S&P 500 (chart), the Nasdaq (chart) and the small-cap Russell 2000 (chart) shattered record after record after record in 2017. In fact the Dow Jones Industrial Average set 70 record closing highs in 2017. That’s not a typo folks, 70 record closing highs. The other aforementioned key indices also set multiple record highs throughout last year. So could we see a repeat performance in 2018? I don’t know about another 70 record highs this year but I would not be surprised to see continuing strength in the markets in 2018. Yes the Federal Reserve is now in a rate hike mode which typically does not bode well for stocks, but this Fed and central banks from around the world understand the need to go about their new rate hike policies in a gradual manner. Raising rates too aggressively could be the exact catalyst to put the brakes on this almost decade long bull market. I don’t think this will be the case at least with our own Federal Reserve. Jerome Powell will be replacing Janet Yellen in early February as our new Federal Reserve Chairman. Mr. Powell who has been a member of the Federal Reserve’s board of governors since 2012 has voted for keeping interest rates at bay while the economy continues to recover.

Speaking of the economy, expansion continues to occur and we will soon find out how our economy is  trickling down into corporate America. Fourth quarter earnings reporting season will begin here in January and this could very well serve as a key catalyst for the continuation of the bull market. That said, I think most investors and traders are looking for the markets to pause and pullback from this historic run we continue to be on. It is truly breathtaking to witness the record pace that stocks have enjoyed for years now. Personally, I hope and some point in time we do get a meaningful pullback so we can have the opportunity to step in at lower prices. Good luck to all and Paula and I wish everyone the healthiest and happiest new year! 🙂

~George
Record After Record!

Another week in the books and records continue to fall. The Dow Jones Industrial Average (chart) and the S&P 500 (chart) both closed the week at record highs, while the Nasdaq (chart) and the small-cap Russell 2000 (chart) are within a stones throw from their all-time highs. These key indices have been setting records all year long. With the exception of a few minor pullbacks throughout the year, stocks have pretty much gone up in a straight line. This despite a very tepid economic recovery here in the United States with the GDP coming in at a modest increase of 1.4%.

I think it is safe to say that this latest record setting week was due in part to Federal Reserve Chairman Janet Yellen’s dovish comments regarding interest rates and that the Fed would be very gradual in its future hikes and that such action will be determined by how well the economy fares. If the latest retail sales numbers and consumer price index number are indicative of what the Fed will do, we may not see another hike until year end or even 2018? This is just what the markets needed in order to keep a floor not only under the stocks, but the confidence to proceed as business as usual hence record setting highs.

Well the old adage of you can’t fight the tape or the Fed for that matter is certainly playing out so far in 2017. Are there any catalysts out there that could change the markets mind or its direction? Well we are about to enter the busiest week of Q2 earnings reporting season so far with over 440 companies reporting their results next week including the likes of Netflix (NasdaqGS: NFLX), Goldman Sachs (NYSE:GS), International Business Machine (NYSE: IBM), Johnson & Johnson (NYSE: JNJ), United Airlines (NYSE: UAL), American Express (NYSE: AXP), eBAY INC. (NasdaqGS: EBAY) and General Electric (NYSE: GE) just to name a few. The following week over 1400 companies will report their quarterly results. So if there is anything that could slow this bull market down right now this is it. However, if corporate America continues to report solid earnings results, new record highs could very well continue into the foreseeable future. Good luck to all 🙂

~George


Rate Hikes Are Looming…

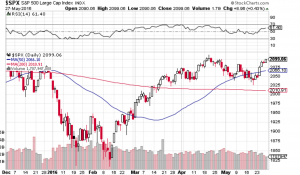
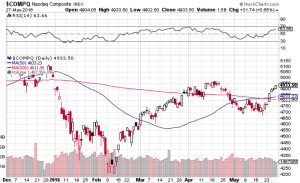
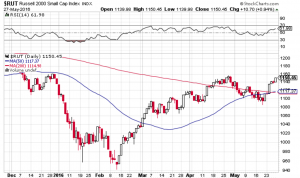
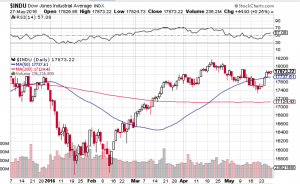
Janet Yellen the chair of the Federal Reserve last Friday signaled that the Federal Reserve is prepared to raise interest rates in the coming months should the U.S. economy continue to improve. Some pundits suggest that a rate hike could come at the Fed’s next policy meeting in two weeks. Despite the rate hike chatter, the markets continue to shrug off what seemingly could be bearish for stocks. The Dow Jones Industrial Average (see chart below) is within striking distance of all time highs. Same can be said for the S&P 500 (see chart below), the Nasdaq (see chart below) finds itself flirting once again with the 5000 mark and the small-cap Russell 2000 (see chart below) appears to have caught a bid and is strengthening.

This type of market activity is counterintuitive when interest rates appear to be heading north. The flip side to this thinking is if the Federal Reserve is willing to raise rates due to a stronger economic back-drop, one can assume that this must be good for corporate America. Logically speaking I agree, however, if history has anything to do with the markets, a rising interest rate environment typically does not bode well for equities. Couple this with the seasonality of the summer months which tend to be weaker months for stocks and the upcoming fall presidential election, and I would say at the very least we will see a rise in volatility. These are very powerful forces that are lining up and I think it’s safe to say the markets will be very reactive to these events.

So what’s a trader or investor do in this landscape? For me personally I think the type of environment we are heading into creates opportunity on the long and short side. I will be paying close attention to overbought and oversold conditions of the markets and select equities throughout the summer and into the fall. As everyone knows by now my favorite technical indicator when it comes to spotting overbought/oversold conditions is the Relative Strength Index also known as the RSI. Many market technicians also favor this technical indicator when assessing market conditions from a technical standpoint. Over the years the RSI has demonstrated its usefulness and if you are not familiar with this technical indicator, you may want to research it out. Click here for starters.

Both Paula and I wish everyone a very safe, prosperous investing and trading summer 🙂

~George Mahfouz, Jr.

Screen Shot 2016-05-30 at 8.00.40 PMGeorge Mahfouz Jr. S&P 500 chartGeorge Mahfouz Jr. Nasdaq ChartGeorge Mahfouz Jr. Russell 2000 Chart


Volatility Back In Vogue…

Since the start of the year there has been a very noticeable uptick in volatility in the marketplace. Twice over the past couple of months volatility has spike past the coveted 30 value level which is considered to be the level that demonstrates a large amount of investor uncertainty and/or fear. This you can see clearly in the chart of the Chicago Board Options Exchange Volatility Index, Symbol: VIX (chart)The VIX tracks the S&P 500 and calculates the next 30-day expectation of implied market volatility of a wide range of call and put options related to the S&P 500. Investors have not seen this type of volatility in quite some time and traders and short sellers have certainly taken advantage of it.

Let’s take a look at what the increase in vol has done to the major averages. Year to date the Dow Jones Industrial Average (chart) is down over five percent, the Nasdaq (chart) is lower by almost nine percent, the S&P (chart) is off by over five percent and the small-cap Russell 2000 (chart) is down almost nine percent on the year as well. That said, these key indices have bounced sharply off of their recent lows in mid-Feburary and crude oil (chart) has seemingly found a interim bottom around the $30 dollar level.

So now what? I am expecting volatility to continue throughout the month of March especially as we lead up into the upcoming Federal Reserve policy meeting March 15-16th. Most experts do not expect the Fed to raise interest rates at this meeting and furthermore not until the economic data consistently proves otherwise.  In fact, there are certain economists out there that think that the Federal Reserve is handcuffed for now and won’t raise rates until the fourth quarter because of the global turmoil that has surfaced this year especially in China and Europe. The current global equity sell-off is without question part of the reason for the increase in vol here in the United States. Whatever the case is, I will be listening to what tone and language Janet Yellen will use at her press conference post meeting to get a sense of what’s next for rates and how this will effect our markets.

Good luck to all 🙂

~George

Stocks Skittish Before The Fed Meeting…

Stocks have become hesitant as to which direction to head into with all eyes now on whether the Federal Reserve will raise interest rates this week for the first time in almost a decade. The Dow Jones Industrial Average (chart) started the week down 62.13, the Nasdaq Composite (chart) closed Monday’s session out down 16.58, the S&P 500 (chart) fell 8 points and the small-cap Russell 2000 (chart) closed modest lower by 4.3 points.

As investors and traders await the decision from the Federal Reserve as to whether or not a rate increase will occur, I think the markets are putting too much emphasis on the initial hike, regardless if it’s announced after the conclusion of their two-day meeting this week. To me what’s more is how will the Federal Reserve respond over the coming months and quarters ahead? Shouldn’t we be more attuned to their behavior pattern after the first hike? Or whether or not they will raise rates at an accelerated rate? To me this is the bigger question. Of course a quarter point rate hike or even a 50 basis point hike is in the cards and is inevitable at some point in time, whether it’s this week or at the Federal Reserve’s future meetings. My focus and attention will be on how they treat the interest rate environment after the first rate hike actually occurs. Based on the temperament and demeanor of Janet Yellen, I would expect a continuing cautious protocol from our Fed Chair and I would think that neither she or the Fed would not be inclined to raise rates too fast. I would think the economic data would dictate the velocity of future rate hikes and even if the data becomes robust, the Federal Reserve would want to see multiple quarters of meaningful expansion before we get back to normalized rates.

That said, I do think that the markets and investors are going to need to get used to increased volatility and market swings similar to what we have been experiencing over the past few months. I believe gone are the days of low vol and indeed investors are going to need to pay attention now more than ever to the true growth rates of companies, especially on the top-line. You see in a rising interest rate environment companies can no longer grow their bottom line alone while maintaining high valuations. Real growth needs to come forward in the form actual sales expansion in addition to productivity in order for companies to maintain elevated P/E multiples. Bottom line, you better know the companies you choose to invest in because the free lunch so to speak that the markets, investors and traders have enjoyed over the past several years may come to a close in the near future…

Good luck to all 🙂

~George

As Expected, New Market Highs Continue…

In my previous blog, I eluded to the notion that the bulls would remain in charge for the foreseeable future and sure enough, in charge they are. Last week, the Dow Jones Industrial Average (chart), the S&P 500 (chart), and the small-cap Russell 2000 (chart) all hit record highs while the Nasdaq (chart) continues to gravitate toward the 5000 level. This market has no quit. With the majority of the S&P 500 companies reporting their Q1 earnings, overall earnings growth was relatively good, topping expectations. Meanwhile, Fed Chair Janet Yellen stated at her biannual meeting with the Senate Banking Committee that the Fed will be patient before any change in interest rate policies and that guidance would be given prior to any such action. This, along with the no real surprises coming out of earnings reporting season and the U.S. labor market showing a continuation of job growth, without question has played a role in the continuing strength of the U.S. stock market.  

Okay, all clear right? Well, we all know there is always the other side to the story and markets do not go up in a straight line forever. Without many upcoming catalysts in March, or in any given time period where catalysts are few, I always refer to the technical shape up of the markets to see if overbought or oversold conditions exist. As you all know by now, one of my favorite technical indicators to gauge whether or not the markets are in extreme conditions, is the Relative Strength Index. If you go back historically and look at the RSI indicator of any given stock or index, you too can see the reliability of this particular indicator when it reaches overbought or oversold conditions. Click on this link to get the definition of the RSINow I am not saying to completely base trading or investment decisions off of this technical indicator or any other technical indicator for that matter. However, for me personally this has proven to be a trusted guide and I do include this analysis when viewing the current market environment. That said, we are beginning to look a little overbought and I am going to look for pullbacks before I entertain any new positions in equities. Good luck to all and I wish all a very prosperous month 🙂

~George

Now That’s What I Call A Bounce!

After such a torrid bull run in 2013, where the the four major averages gained over 25%, to no great surprise, these same indexes experienced more than a 5% pullback in January and early February. However, over the past couple of weeks and true to form, these indexes not only bounced off of key technical support zones, but they also took back their 50-day moving averages. For the week, the Dow Jones Industrial Average (chart) finished up 2.28%, the Nasdaq (chart) had a gain of 2.86%, the S&P 500 (chart) +2.32% and the small-cap Russell 2000 (chart) closed the week up 2.92%. The markets responded with a roar as the new Fed chairwomen Janet Yellen, in her first public appearance at the helm of the Fed, reiterated her commitment to model after the Bernanke era monetary policies. Stocks were already recovering from the January correction but accelerated their gains as she spoke to Congress this past Tuesday. All expectations now are that stocks will remain buoyed by the continuing asset backed purchases despite the modest tapering that is now in effect.

In my previous blog I expressed concern over the technical breakdown of the markets and that the 50-day moving averages of the key indices had been breached. Furthermore, I thought there was a possibility of the 200-day being the next stop. However, I did also indicate that if the markets were able to rebound and take back their 50-day and remain above that mark, that would be a positive. This is where we find ourselves now. All of the aforementioned key indexes have traded and closed above this key technical metric. The question now becomes whether or not this slingshot bounce and break above the 50-day is sustainable? Q4 earnings reporting season really didn’t say too much about the growth of corporate America, which overall was a mixed bag at best for the majority of the sectors. Couple this with economic signs of weakness as retail sales growth still remains flatlined, and I think we will continue to experience choppy waters for stocks, and I would be surprised if we began making new high after new high like last year. That said, liquidity for stocks is seemingly plentiful and we are still in a strong seasonality period for equities, so I also wouldn’t be surprised if we stabilized above the 50-day and consolidated for an extended period of time. Unless of course there is an unexpected negative geopolitical or global macro event that creeps back into the mix, then all bets are off. I will continue to track the technicals to gauge entry and exit points while using protective stops along the way. Good luck to all and both Paula and I wish everyone a very safe and happy Presidents’ Day holiday. Please note the markets are closed on Monday in recognition of Presidents’ Day.

Have a great weekend 🙂

~George

No Bubble Here…

At least according to Janet Yellen as she spoke before the Senate Banking Committee on Thursday. In a prepared speech to the committee, Vice Chair Yellen stated that the U.S. economy continues to improve and that the housing market has turned a corner with construction, home prices and sales up significantly. Ms. Yellen went on to indicate that she supports the Federal Reserve’s monetary policies which continue to purchase bonds and mortgage backed securities. Investors took this cue as a very positive sign going forward and sent the markets yet again to all time highs this past week.

For the week, the Dow Jones Industrial Average (chart) closed up 1.3% and is also closing in on the 16,000 mark, the S&P 500 (chart) gained 1.6%, the Nasdaq (chart) +1.5% and the small-cap Russell 2000 (chart) finished the week up 1.47%. Stocks continue to be on a tear and now it is clear that unless their is some unforeseen negative macro-event that occurs from now until year end, these markets should close the year out with over 20% gains respectively. Now that doesn’t mean that pullbacks or even a modest correction couldn’t occur, but should this be the case, I would assume that any retracement would be met with the “buying the dip” mentally that has gone on all year long.

Now let’s take a look at how the technical conditions are shaping up for the aformentioned key indices. When I consider running a technical analysis on stocks or indexes, the two indicators I favor the most are the Relative Strength Index also know as the RSI and the moving averages. Out of plethora of technical indicators out there, these particular indicators are the most reliable, at least for me. Part of the reason why I favor the RSI and moving averages indicators are that many computerized trading models and certain institutional investors utilize them, which in turn moves the market. Historically, when the Relative Strength Index (RSI) is at an overbought or oversold condition, the majority of the time the asset or index reverts back to the mean. Same rings true with the moving averages, whenever a stock or index rises up against or comes down to its moving average, typically the stock or index finds support or resistance. So in looking at the current state of the Dow (chart), S&P 500 (chart) , Nasdaq (chart) and the Russell 2000 (chart) all of these indexes are indeed approaching overbought territory which according to the RSI definition is the 70 value level, but they are not there yet. Actually, my personal preference is to not only see a breach of the 70 value level but a continuation up into overbought territory before I consider selling into that condition. As it pertains to the moving averages technical indicator, these key indices are all comfortably above their respective 20-day and 50-day averages, with the 200-day moving average no where in sight.

So what does all of this mean? Technically speaking and considering we are heading into year end, there is a high likelihood that markets continue to head north, but I will be paying close attention to the technicals as to when we may see the inevitable pullback.

Good luck to all and have a great weekend 🙂

~George