The Tariff Trade…

The tariff trade is now in play. Stocks ended the month lower in response to the White House confirming that tariffs on Mexico, Canada and China begin today. This has been no secret that tariffs would be imposed on select countries, but I guess reality sunk in went in was confirmed yesterday.

The Dow Jones Industrial Average (see chart here) closed the month of January down 337 points, the S&P 500 (see chart here) closed lower by 30 points, the Nasdaq Composite (see chart here) gave up 54 points and the small-cap Russell 2000 (see chart here) closed the month of January down around 20 points. Despite yesterday’s pullback, the month of January overall was a strong month for the markets.

When countries impose tariffs on each other consumers lose. The costs of tariffs typically is handed down to the consumer which will impact consumer spending and the economy. From fruits and vegetables, to lumber, to oil to cement, etc. the list goes on. Seemingly everything is about to get more expensive which of course will lift inflation. What a minute, aren’t things supposed to get cheaper and isn’t inflation supposed to be coming down? Clearly that isn’t happening now. Let’s hope that the political chess game does not go on for an extended period.

The sectors and stocks that will be most impacted by these newly issued tariffs are consumer discretionary stocks, materials stocks, the industrials, healthcare stocks and technology stocks. Yea, that’s pretty much our whole economy. So, time will tell how the markets will continue to react but it is pretty clear what will be happening here in the short term.

As I look at the technical shape of the major averages, they all remain solidly above their 200 and 100-day moving averages, but with yesterday’s selloff the key indices fell to their 20-day M/A and found support there before the market closed. Next week we will see if the support level can hold.

Good luck to all 🙂

~George


Like It’s 1999!

Stocks are partying like it’s 1999 and it is breathtaking to say the least! The Dow Jones Industrial Average (see chart here) once again set a record high on Friday, closing just under the 45000 level. The S&P 500 (see chart here) also set an all-time high closing above 6000. The Nasdaq Composite (see chart here) is remaining strong above the 19000 mark and the small-cap Russell 2000 (see chart here and below) finally made a new all-time high last week after lagging most of the year.

What in the heck is going on with the major averages and these non-stop record highs? Well, one thing to point to is the end of the 2024 election. After the results came in, stocks, crypto and seemingly everything under the sun took off! Why you ask? Well the uncertainty of would get in in is over and clearly the markets liked the results! Are we looking at some form of irrational exuberance here? Or do the markets deserve this type of non-stop record highs?

One of the metrics I have consulted with is the price to earnings ratio aka the “p/e” ratio of the S&P 500 index. The price to earnings ratio is the ratio of a company’s share price to its earnings per share. This ratio is used for valuing companies to find out how they are priced. Now when I look at the overall p/e ratio of the S&P 500 (see chart here) it is trading just under a 30 price to earnings ratio. The historic price to earnings ratio of the S&P 500 is around 17. I think it is safe to say that stocks may be getting ahead of themselves comparatively speaking. Another metric I also consult with is the relative strength index aka the RSI. The Relative Strength index is a technical indicator that demonstrates whether a stock or index is overbought or oversold. Currently the RSI on the aforementioned indexes is approaching overbought territory according to the RSI principles.

Let’s not forget stocks and/or indexes can remain overbought for extended periods of time, however, earnings must indeed reflect or catch up to where the values are currently trading at.

Good luck to all 🙂

~George

The Time Has Come…

The time has come for this election to be over. I don’t know about y’all, but I am exhausted by the way these politicians, and the entire political backdrop has gone. Is it possible to hear any more lies? Is it possible to see any more ads? Raise your hands if you want to see anymore yard signs! What in the world has happened to our country? Seriously, who can take any politician or surrogate seriously anymore? How can these people sit up there with a straight face with the words they say and the lies they spew? Not to mention the crazy conspiracy theories that are kicked out seemingly on the daily.

What’s worst there are millions of people that align and are okay with this behavior. What, for their own political gain or for their own financial benefit? What an embarrassment this is not only here at home but to the entire world! What happened to honesty? What happened to decency? What happened to our country? I can only hope and pray for a better future for our country, our children, our grandchildren and for future generations.

Now the markets do not seem to care to what’s going on politically. Despite the recent sell-off over the past week, stocks and other highly volatile assets continue to trade near their all-time highs and are now finding some support. The Dow Jones Industrial Average (see chart here) is trading around 42000, the S&P 500 (see chart here) is trading in the 5700-5800 zone, the Nasdaq Composite (see chart here) is north of 18000 and the small-cap Russell 2000 (see chart here) is currently trading above 2200. The economy and job market are still the primary driver of why the stock market has performed so well. It also does help that the Federal Reserve is lowering interest rates which historically bodes well for stocks and derivatives alike.

Good luck to all 🙂

~George

About A Month Away…

We are about a month away from the election and the markets seemingly don’t care or have any new concerns. Once again both the Dow Jones Industrial Average (see chart here) and the S&P 500 (see chart here) hit records. The Nasdaq Composite (see chart here) and the small-cap Russell 2000 (see chart here) are trading positively as well.

Without question there is even more confidence in the markets now that the Federal Reserve is cutting interest rate. Not only did the Fed cut interest rates by 1/2  point last month, Jerome Powell the Chairman of the Federal Reserve signaled more rate cuts are forthcoming. Couple this new sentiment from the Federal Reserve along with growing confidence in the economy and the job market, it’s no wonder the Dow Jones (see chart here) and the S&P 500 (see chart here) are once again setting all-time highs. Some pundits are beginning to call this a “goldilocks economy” while others are waiting for the next shoe to drop. As far as the next big catalyst is concerned, well clearly it’s the upcoming Presidential election. However, here in October we will begin to see Q3 earnings results being reported from corporate America. This too is expected to be a tell-tale sign of how companies are currently faring and we should definitely see how the consumer is feeling, especially with the rate cut and the positive impact that is having on consumers. This new backdrop should begin trickling down to corporate America revenues and future forecasts.

Let’s take a quick look at the technical shape of the indexes. The Dow Jones Industrial Average (see chart here) and the S&P 500 (see chart here) are trading near the upper end of the trading range they have been in. Please note neither index is in “overbought” territory yet but are approaching the 70 level of the RSI aka the Relative Strength Index. As I look at the Nasdaq Composite (see chart here) and the small-cap Russell 2000 (see chart here), these indexes are finding support at their 20-day moving averages. So technically speaking things look to be ok here too.

Good luck to all 🙂

~George

Earnings And The Election…

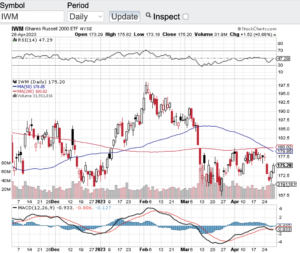
Now that the first half of the year is in the books in which we witnessed the markets hitting all-time highs, investor focus should shift to Q2 earnings reporting season and the upcoming election.  Once again the S&P 500 (see chart here) and the Nasdaq Composite (see chart here) hit record highs on Friday to close out the month of June. The Dow Jones Industrial Average (see chart here) is hovering around the 39000 zone, while the small-cap Russell 2000 (see chart here) continues to bounce around the 2000 level.

After the much-anticipated Presidential debate which is the first one in this election year, stocks reacted in a volatile manner on Friday. As mentioned above the S&P 500 (see chart here) and the Nasdaq Composite (see chart here) both set all-time highs on Friday before reversing and closing lower on the day. I am not sure why stocks took off at the open on Friday and set all-time highs especially with how the debate went on Thursday night. I refused to watch the debate for a variety of reasons and from what I am hearing and reading, I am glad I did not watch it. There are no words for what is going on here in our country and I will leave it at that. I’d rather focus on the positive which are the markets and how incredibly resilient they are.

As I look at the back half of the year, stocks should be put to the test from here on out. Q2 earnings reporting season is on deck with most companies reporting their results after the 4th of July holiday. Without question analysts and investors alike will be focused on the health of corporate America and how they are growing their top and bottom lines. This should be one of the main factors on whether this powerful rally continues. The other wild card in the mix is the upcoming election. Depending on how things shake out between now and the actual election, this could have an impact of a “black swan” type event and if this is the case, then we could see one wild ride into year-end.

Good luck to all 🙂

~George

Dow 40000, Now What?

Last month we witnessed the Dow trade above 40000 for the first time ever and now the question is, now what? Yes, that’s right, the Dow Jones Industrial Average (see chart here) eclipsed the 40000 marks for the first time in its history. I remember back in 1999 there was a book that I bought titled “Dow 40000” by David Elias. Mr. Elias predicted that the Dow would hit 40000 by the year 2016. Well, that might have been a bit too optimistic regarding the timeframe, but as we just witnessed, his prediction of Dow 40000 came true. For me as I read that book, the Dow was trading in the 10000 zone, and this was nearing the height of the dot-com boom. My view at that point in time was how in the world can the Dow Jones Industrial Average triple from here after it more than tripled during the dot-com boom. It took 25 years to do so and now the question on many investors’ minds is “has become was a short-or near-term top?” Based on how the Dow has responded after reaching that record high of 40000, it sure appears that way.

After topping 40000, the Dow Jones Industrial Average (see chart here and below) the Dow gave back 2000 points over the course of the next week or so and then on Friday bounced back to close at 38600 which is right at its 100-day moving average. The Dow wasn’t the only index to reach record heights. The Nasdaq Composite (see chart here) also hit an all-time high last month topping the 17000 mark, the S&P 500 (see chart here) hit an all-time high of 5346 while the small-cap Russell 2000 (see chart here) is seemingly locked in a trading zone between 1900 and 2100.

I remain in awe of the strength of the stock market despite all the headwinds our economy faces and with the geopolitical backdrop. We also cannot forget this is an election year like no other. To that end, I am expecting volatility to rear its head this summer and as we head into the fall.

Good luck to all 🙂

~George


The Technicals Are In Play…

As the markets try to find their footing, the technicals are surely in play. After a record-breaking performance over the past few months, the major averages are flirting with breaking down. The Dow Jones Industrial Average (see chart here) recently broke down below its 20 and 100 day moving average, as did the small-cap Russell 2000 (see chart here). Both the S&P 500 (see chart here) and the Nasdaq Composite (see chart here) have broken down through their 20 day moving averages, however, these indices are finding support at their 100-day M/A.

The recent market action to me is no surprise. As I alluded to in my previous blogs, month over month stocks and the major averages have been setting all-time highs. At some point in time a pause and reversal in stocks is to be expected. That time appears to be here and now. Of course, there are other factors weighing in on the markets recent pullback with the spotlight coming back on to the inflationary backdrop our economy has faced. Inflation has dropped dramatically over the past year, however, recently there has been an uptick in key sectors, click here for a recent report on the consumer price index. Now pundits are tying the most recent consumer price index into a narrative that the Federal Reserve may not be cutting interest rates after all. Some economists are even suggesting the Fed may even hike rates should inflation continue to uptick.

I come from the camp that a bump in the road with a slight uptick on inflation is nothing to panic over. Now if over the next couple of months the CPI continues to rise, then this would be a different discussion. In the near term if the major averages are able to hold here at the key support zones, then the recent pullback should find some footing. If the selling pressure continues then the 200-day moving average could be the next stop.

Good luck to all 🙂

~George

Record Highs For Stocks!

Record highs for stocks are hitting the tape with both the Dow Jones Industrial Average (see chart here) and the S&P 500 (see chart here) hit all time highs yesterday. The Dow Jones Industrial Average hit a high of 38,588 while the S&P 500 traded at 4931 before closing slightly lower. However, the Nasdaq Composite (see chart here) and the Russell 2000 (see chart here) did not hit their all-time highs but the uptrend in those indexes continue.

So why are two of the major averages at all-time highs? For one I think the markets have been anticipating the Federal Reserve to start cutting interest rates this year. However, Fed Chair Jerome Powell yesterday said rate cuts in the near term is not likely. Suffice to say the markets did sell off yesterday after Chair Powell’s remarks. The other factor driving stocks higher is the undeniable strength our economy and the job market. The latest Gross Domestic Product (GDP) report surprised analysts yet again. Economists were expecting the GDP to come in at an annualized growth rate of 1.5%. Instead, the economy grew on an annualized basis of 3.3%. I’d say that’s a beat! The GDP is a measure used to evaluate the strength of the economy. The GDP is the total market value of the final goods and services produced in a given country.

Going forward without question the strength of the economy and job market, along with inflation, will be guiding the Federal Reserve as to the timing of when they will begin to cut rates. Until then, the strength of companies’ earnings results, geo political factors and our own political backdrop should be the catalysts that determine where the markets trade.

Last but not least, the technical backdrop of the key indexes is in decent shape. Yes, the Dow Jones Industrial and the S&P 500 did breach the 70 RSI level briefly but has retreated some since going into overbought territory. All in all, from a technical standpoint, I do not see any alarming trends.

Good luck to all 🙂

~George


Cheers To The Markets!

Cheers to the markets and what a year for stocks! 2023 turned out to be a spectacular year for the stock market as not many expected the markets to rip-roar as it did last year. The Dow Jones Industrial Average (see chart here) finished the year up almost 14 percent. The S&P 500 (see chart here) closed the year up 24%. The Nasdaq Composite (see chart here) closed the year up a whopping 44 percent. A big part of the Nasdaq’s eye-popping performance was how the “Magnificent 7” performed. For those of you who do not know who the Magnificent 7 are, it is the big tech group made up of Apple (NasdaqGS: AAPL), Microsoft (NasdaqGS: MSFT), Google owner Alphabet (NasdaqGS: GOOGL), Amazon (NasdaqGS: AMZN), Nvidia (NasdaqGS: NVDA) and Meta Platforms (NasdaqGS: META) and Tesla (NasdaqGS: TSLA). Finally, the small-cap Russell 2000 (see chart here) closed the year up 15%.

Many stock market experts did not expect such a stellar year for stocks. Let’s dig in and see what happened. For starters, inflation itself retreated faster than anyone expected which now has the Federal Reserve speaking to cutting rates in 2024. This metric alone is very bullish for stocks. Then factor in how strong the economy has been it’s no wonder we are at or near all-time highs. What’s equally impressive is how the markets have shrugged off the geopolitical backdrop. From two wars that seemingly have no end is sight, to the U.S. political divide, to China’s stagnant economy, nothing seems to be bothering the markets, at least not yet.

As we now look forward to 2024, I think we are in for a doozy of a year, at least from a volatility standpoint. We are also in an election year, and this alone should create higher volatility. I would also expect that after such a strong performance in 2023 that a pause and/or even a correction of some sort could potentially be in the cards for the markets in general.

Wishing everyone the healthiest, happiest, and most prosperous new year 🙂

~George

Soft Month For Stocks…

August was a soft month for stocks across the board. The Dow Jones Industrial Average (see chart here) closed the month of August down 2.4%, the S&P 500 (see chart here) fell a modest 1.8%, the Nasdaq Composite (see chart here) gave up 2.2% and the small-cap Russell 2000 (see chart here) fell by over 5%. All things considered, not too shabby considering August historically is one of the weakest months of the year for stocks.

The market performance in August did snap a 5-month winning streak for the S&P 500 and the overall volatility in the stocks also picked up some steam. However, I do think the bulls will take such a modest pullback considering how strong the markets had been since early June. It appears some profit taking occurred in August while overall trading volumes were relatively lower. Now that summer is almost behind us, I expect trading volumes to increase along with the possibility of bigger market swings as we head into fall.

Now that we are in September the question becomes can the market weakness in August turn around in September? I typically look for catalysts to see if market direction will turn and as we head into September overall bullish sentiment has decreased. As contrary as this may sound, bullish sentiment decreasing is usually a bullish sign for the markets. I don’t like participating in markets where the sentiment is overly bullish and this has been the case all summer long, especially with how AI stocks went on a tear over the summer. The Artificial Intelligence sector lifted most indexes and if it wasn’t for the AI craze we have witnessed, I am not so sure if the markets would have enjoyed a multi-month bull run.

I always like to look at the technical shape of the markets as another potential catalyst for market moves. There is nothing really standing out either bullish or bearish. From the relative strength index aka the RSI, to where the moving averages are currently positioned, there is nothing too glaring one way or the other. Not a surprise considering how low the trading volumes were in August and the modest pullback that did occur.

Good luck to all 🙂

~George