53 Record Highs And Counting…

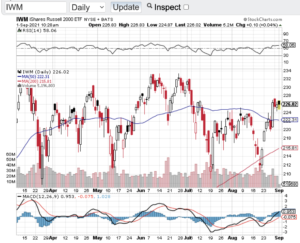
The S&P 500 (see chart here) has hit 53 record highs so far in 2021 and counting. That’s right folks 53 all-time highs this year alone. The Nasdaq Composite (see chart here) has logged 32 record highs in 2021 as well. The Dow Jones Industrial Average (see chart here) has also been on fire trading above the 35000 level and the small-cap Russell 2000 (see chart below) continues to perform alongside the aforementioned bellwether indexes. How much longer can this bull run? I think it began with the Federal Reserve and its longstanding monetary policies and now there seems to be a subtle change in the Fed’s position.

Last Friday at the Federal Reserve’s Jackson Hole Economic Symposium, Fed Reserve chairman Jerome Powell signaled again that the Fed would soon begin to pullback on its $120B per month bond asset purchases. This support to the markets and the economy along with a zero percent interest rate backdrop has been THE catalyst to support record high after record high in our stock market. Of course the massive economic stimulus packages that have been disseminated since the start of the pandemic has also played a role in consumer spending which has also propelled stocks to new heights.

Now we all know this cannot go on forever. Free money, zero percent interest rates, asset purchases and the like will end at some point in time. The question then becomes what happens to the stock market when all of this support winds down? Friends the answer is simple. Corporate America is going to have to produce on its own. Meaning this, for the continuation of this decade long bull market, companies will have to not only have to catch up with their current valuations they will have to exceed expectations going forward. This will certainly separate real growth companies from the rest of the pack and that’s when we just may see a more normal ebb and flow in our markets. Good luck to all 🙂 and have a safe and Happy Labor Day weekend.

~George
53 In a Row And Counting - Paula Mahfouz


Bellwether Indexes Surge To All Time Highs!

Bellwether indexes surge to all time highs as the S&P 500 (chart) closed the month of August at 2901, the Nasdaq Composite (chart) closed at 8109, the small-cap Russell 2000 (chart) closed at 1740 and the Dow Jones Industrial Average (chart) is within striking distance of its all time high. I thought August is supposed to be a tough month for stocks? Not this year! New highs are happening while the political environment in our country is at a seemingly all-time low, the word impeachment surfaces daily now, tariffs are in the headlines daily, interest rates have been on the rise and now it seems that any type of progress made over the summer with North Korea may be in jeopardy. One would think that the aforementioned risks would be enough for an outright 10-20 percent market correction. Add in the seasonality factor and we should indeed be going red, not making all-time highs.

Now I am afraid to even mention that the month of September is historically the weakest month of the year for stocks right alongside with August. Do I dare say that September will be the month that our markets correct in a meaningful way? Do I have the courage to predict that this will be the month where the markets recognize and adjust for all of the risks that are present in our current environment? I don’t know people, I am as baffled as the next guy as to how these markets keep shrugging off real market issues. Oh by the way I forgot to mention we have mid-term elections forthcoming, the markets are not pricing in any risk there either. These markets are priced and acting like there is no absolute risks at all out there. Ok enough banter already!

How to play the markets now? I am a fan of the old adage “the trend is your friend” but folks I just can’t hop on this train at this point in time. I am heading to the sidelines until I see any type of technical breakdown to possibly consider implementing a short thesis or just wait for the inevitable pullback/sell-off to identify any potential long set-ups. Until then, Paula and I wish everyone a very safe and Happy Labor Day weekend 🙂

~George

Is Gold Breaking Out?

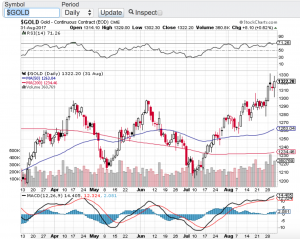
It certainly appears that way. Gold (see chart below) has caught a meaning bid as of late and it’s about time. The yellow medal has been stuck in a trading range between $1200 and $1300 per ounce for months and now has broke through the $1300 level currently trading around $1330 per ounce. What has surprised me is how long it took for gold to finally go from the left side of the chart to the right. Especially considering the geopolitical risk environment we find ourselves in. That said, stocks are saying what risk? As I write this blog, the Dow Jones Industrial Average (chart), the S&P 500 (chart), the Nasdaq (chart) and the small-cap Russell 2000 (chart) once again are all approaching all time highs. This after a very modest pullback in August. So Wall Street continues to remain in the “buy the dip” mood. All year long and every single time stocks experience any type of pullback, buyers come in and lift the markets to all time highs.

How long can this last? From a technical standpoint the key indices remain below the 70 value level of the relative strength index also referred to as the RSI. The RSI is used as a gauge by certain market technicians to see if whether or not stocks in the short term are overbought or oversold. As as these indexes approach all-time highs and should they breakthrough those highs, these markets can and should continue to go higher. However, if they do not breakout here, then one could expect yet another pullback especially as we are now in one of the more underperforming months for equites of the year. Historically September and October for that matter tends to be a difficult time for the markets. However, based on what we have witnessed all year long despite the ongoing geopolitical risks and with interest rates on the rise, the markets may not care about the seasonality trends of September and October. Good luck to all and both Paula and I wish everyone a safe and relaxing Labor Day Weekend 🙂

~George

Gold chart - Paula Mahfouz