About A Month Away…

We are about a month away from the election and the markets seemingly don’t care or have any new concerns. Once again both the Dow Jones Industrial Average (see chart here) and the S&P 500 (see chart here) hit records. The Nasdaq Composite (see chart here) and the small-cap Russell 2000 (see chart here) are trading positively as well.

Without question there is even more confidence in the markets now that the Federal Reserve is cutting interest rate. Not only did the Fed cut interest rates by 1/2Β  point last month, Jerome Powell the Chairman of the Federal Reserve signaled more rate cuts are forthcoming. Couple this new sentiment from the Federal Reserve along with growing confidence in the economy and the job market, it’s no wonder the Dow Jones (see chart here) and the S&P 500 (see chart here) are once again setting all-time highs. Some pundits are beginning to call this a “goldilocks economy” while others are waiting for the next shoe to drop. As far as the next big catalyst is concerned, well clearly it’s the upcoming Presidential election. However, here in October we will begin to see Q3 earnings results being reported from corporate America. This too is expected to be a tell-tale sign of how companies are currently faring and we should definitely see how the consumer is feeling, especially with the rate cut and the positive impact that is having on consumers. This new backdrop should begin trickling down to corporate America revenues and future forecasts.

Let’s take a quick look at the technical shape of the indexes. The Dow Jones Industrial Average (see chart here) and the S&P 500 (see chart here) are trading near the upper end of the trading range they have been in. Please note neither index is in “overbought” territory yet but are approaching the 70 level of the RSI aka the Relative Strength Index. As I look at the Nasdaq Composite (see chart here) and the small-cap Russell 2000 (see chart here), these indexes are finding support at their 20-day moving averages. So technically speaking things look to be ok here too.

Good luck to all πŸ™‚

~George

Strongest Performance In 5 Years…

Stocks took off in the first quarter with the S&P 500 (see chart here) delivering its strongest Q1 performance in 5 years gaining over 10%. The Dow Jones Industrial Average (see chart here) also closed Q1 with a gain of 5.6%, the Nasdaq Composite (see chart here) finished the quarter up over 9% and the small-cap Russell 2000 (see chart here) finished up around 5%. So, as I posted last month, stocks continue their record setting ways.

So why are the markets continuing to demonstrate strength despite interest rates remaining high relative to when this bull market started? I think part of the answer is right there. The Federal Reserve is continuing to indicate that three interest rate cuts remain in place for 2024 which is bullish for the markets.

Another first quarter driver of the markets can be attributed to the “Magnificent 7”. Nvidia (Symbol: NVDA), Meta Platforms (Symbol: Meta), Amazon (Symbol: AMZN), Microsoft (Symbol: MSFT), Alphabet (Symbol: GOOGL), Apple (AAPL) and Tesla (TSLA) are the Magnificent 7 and are responsible for 40% of the S&P 500’s (see chart here) gain in Q1. This dynamic too attributed to the momentum stocks witnessed in the first quarter although there are a couple of chinks appearing in the armor of the Magnificent 7 and that is the recent under performance of Apple and Tesla. Personally, I would like to see a broader rally here not just 7 stocks that are making up a big percentage of the overall gains.

That being said, and now that the first quarter of the year is in the books, earnings reporting season begins here in April. Earnings season should be the next catalyst as to where stocks and indexes go. As I just spoke to, I would like to see a broader based rally and Q1’s earnings results just might deliver results that could extend this year’s impressive rally. However, if corporate America issues flat to softer results, we could see a pause in this rally and even a potential pullback.

Good luck to all πŸ™‚

~George

Record Highs For Stocks!

Record highs for stocks are hitting the tape with both the Dow Jones Industrial Average (see chart here) and the S&P 500 (see chart here) hit all time highs yesterday. The Dow Jones Industrial Average hit a high of 38,588 while the S&P 500 traded at 4931 before closing slightly lower. However, the Nasdaq Composite (see chart here) and the Russell 2000 (see chart here) did not hit their all-time highs but the uptrend in those indexes continue.

So why are two of the major averages at all-time highs? For one I think the markets have been anticipating the Federal Reserve to start cutting interest rates this year. However, Fed Chair Jerome Powell yesterday said rate cuts in the near term is not likely. Suffice to say the markets did sell off yesterday after Chair Powell’s remarks. The other factor driving stocks higher is the undeniable strength our economy and the job market. The latest Gross Domestic Product (GDP) report surprised analysts yet again. Economists were expecting the GDP to come in at an annualized growth rate of 1.5%. Instead, the economy grew on an annualized basis of 3.3%. I’d say that’s a beat! The GDP is a measure used to evaluate the strength of the economy. The GDP is the total market value of the final goods and services produced in a given country.

Going forward without question the strength of the economy and job market, along with inflation, will be guiding the Federal Reserve as to the timing of when they will begin to cut rates. Until then, the strength of companies’ earnings results, geo political factors and our own political backdrop should be the catalysts that determine where the markets trade.

Last but not least, the technical backdrop of the key indexes is in decent shape. Yes, the Dow Jones Industrial and the S&P 500 did breach the 70 RSI level briefly but has retreated some since going into overbought territory. All in all, from a technical standpoint, I do not see any alarming trends.

Good luck to all πŸ™‚

~George


Is The Bounce Real?

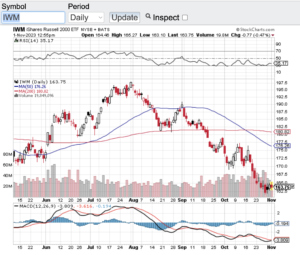
After the major averages breached their 200-day moving averages, the question now becomes, “is the bounce that is currently underway real? Last month I wrote about how the 200-day moving averages were in play. Meaning we could see either a bounce off of the 200-day or a breach of it with markets heading lower. Despite trying to bounce off of their 200-day, ultimately in the second half of October the Dow Jones Industrial Average (see chart here), the S&P 500 (see chart here), the Nasdaq Composite (see chart here) and the small-cap Russell 2000 (see chart here and below) began their decent and breached this key technical support line.

Now the question becomes “can the rally we are seeing this week continue?” Well if you look at the latest GDP report and how our economy grew in the 3rd quarter, it would be easy to assume the markets will continue rallying. The U.S. Gross Domestic Product aka the GDP is a monetary measure of the market value of all final goods and services is a specific time period. In this case it was the 3rd quarter of this year. The U.S. economy grew faster than expected in Q3 coming in at 4.9%. This increase was due in part to consumer spending, increased inventories as manufacturers gear up for the upcoming holiday season and government investments. As mentioned above, it is easy to assume that the markets will continue rallying, however, there is a catch.

With our economy showing this type of strength, this will most likely grab the attention of the Federal Reserve as it pertains to their current interest rate policy. It’s no secret that the Fed has been raising interest rates to stem inflation. Well, when you have such a strong GDP report such as the one that was just issued, this could impact the Fed’s decision with continuing to raise rates, or at the very least maintain the current interest rate dynamic. Markets tend to want to see interest rate stability before any sustainable rally ensues. That being said, the recent interest rate hikes may be enough to weather the stronger than expected economy we saw in Q3.

Good luck to all πŸ™‚

~George

Is The Bounce Real? - Paula Mahfouz


Is A Soft Landing Ahead?

For months now stock market pundits have been calling for a recession. Now it appears that a soft landing is ahead. You name it from Wall Street analysts to the media, not a day goes by without hearing the word recession. Well folks the economic data that has been coming out lately is showing just how strong ourΒ  economy remains. The latest gross domestic product (GDP) report Β that was issued last week showed that in the second quarter of this year our economy grew by 2.4% which surprised the street. What’s more is that this the fourth straight quarter of economic expansion. This sure doesn’t sound like a recession to me. Our economy is growing despite the Federal Reserve continuing to raise interest rates. As of now it sure does look like the Federal Reserve is managing these rate hikes to perfection.

The stock market sure likes what it is seeing from the economy. The Dow Jones Industrial Average (see chart here) continues to remain above its recent breakout. The same can be said for the S&P 500 (see chart here), the Nasdaq Composite (see chart here) and the small-cap Russell 2000 (see chart here). As I alluded to in my July blog, it appeared that stocks were on the verge of breaking out. Sure enough, the month of July was a very bullish month not only on the economic front but also for the stock market. One thing I now want to look for now is if stocks are becoming overbought?

As I look at some of the key technical indicators such as the RSI and the Moving Averages technical indicators nothing too alarming there from a technical standpoint. The exception here is both the Dow Jones Industrials (see chart here) and the S&P 500 (see chart here) are flirting with becoming overbought based on the relative strength index aka the RSI. That said, this is no surprise due to how strong the markets performed in month of July. Let’s see if there is a pullback of some sorts here in August or the continuation of this bullish action.

Wishing everyone the best of luck πŸ™‚

~George

Have We Bottomed Yet?

The million-dollar question that is populating the airwaves right now is “have we bottomed yet”? I think the answer lies in two things, first and foremost, the Federal Reserve and whether they will pull back some on their interest rate hikes. And the second question that comes to mind is how corporate earnings perform as this year continues to unfold. Well, the bull case is inflation will continue to ease which should slow down the Fed’s interest rate hikes. The bear case is inflation is still high and that it is going to take time for 2% inflation which is the Federal Reserve’s target. Needless to say, volatility should be in play for the foreseeable future.

The markets did close out the month of January on a high note. Yesterday, the Dow Jones Industrial Average (see chart here) closed up 368 points closing over the 34000 level. The S&P 500 (see chart here) finished the month of January up 59 points, the Nasdaq Composite (see chart here) closed up 190 points and the small-cap Russell 2000 (see chart here) closed up 46 points on the last day of January.

Technically speaking these key indexes also appear ready to run some more. Each of these key indexes are finding support at their respective 20-day, 50-day, 100-day and 200-day moving averages. As I look at the relative strength index aka the RSI, there is yet another technical indicator thatΒ  appears to favor stocks for a continuation to the upside. After a slight retracement of the RSI there are no overbought conditions yet as defined by the RSI.

All in all, I think the stock market is performing quite well considering the headwinds that are currently present. From high inflation to corporate earnings compression, to the ongoing geopolitical backdrop, I think the bulls will take the markets performance so far this year. And as mentioned above, I would not be surprised to see volatility in stocks for the foreseeable future.

Good luck to all πŸ™‚

~George

Who’s Ready For The New Year?

After one of the weakest market performances since 2008, who is ready for the new year? I know I am!

Let’s take a look at how the major averages closed the year out. The Dow Jones Industrial Average (see chart here) finished lower by 8.78%, the S&P 500 (see chart here) shed almost 20%, the Nasdaq Composite (see chart here) fell a whopping 33% and the Russell 2000 (see chart here) closed the year down over 21%. Despite the bear market we now find ourselves in let’s not forget of how we got here. For the past 10 plus years and especially the past 3 years, central banks from around the world flooded the system with enormous liquidity. This liquidity came in many forms and with essentially charging little to no interest. The Federal Reserve Banks from around the globe started these programs when the 2008 financial crisis hit and for the better part of 15 years had not let up. What changed their position is how inflation took off this year to rates not seen in over 40 years.

Fast forward to today and we now have watched the Federal Reserve raise interest rates multiple times over the past several months and along with that taking the stock market with it. That said, I don’t blame the Fed for raising rates, in fact some pundits might argue as to why it took so long. Oh yea, a once in a century global pandemic shocked the world and the economy. So, what should have been a policy shift years ago became extended stimulus parade of liquidity into the system. Which by the way was very needed. Ok, so let’s not panic as to what occurred in the markets last year, from my vantage point this appears to be simply a function of interest rates and markets beginning to normalize.

Wishing everyone the healthiest, happiest, and most prosperous New Year πŸ™‚

Cheers,

~George


The Fed Versus Inflation…

The market environment we find ourselves in is a clear dynamic of the Federal Reserve taking on inflation. The question now is will the Federal Reserve overreach with its interest rate war on inflation? One thing I have learned as it pertains to the markets is not to go against the power of the Fed and to trust they will ultimately steer the ship right.

That being said, what a month to forget for stocks! In the month of September alone the Dow Jones Industrial Average (see chart here) lost almost 9%, the S&P 500 (see chart here) fell over 9% while the Nasdaq Composite (see chart here) and the small-cap Russell 2000 (see chart here) both gave up over 10% in September. I think we are all ready to turn the page on the markets summer performance. In fact, the year to date performance of the major averages are well into bear market territory.

In hindsight it was plain as day how unsustainable asset prices were across the board. From the stock market to the real estate market to the crazy land of cryptos. The excesses that the markets enjoyed while they were hot was a direct reflection of the Fed’s easy monetary policies. From essentially zero percent interest rates, to buying up treasuries and other asset classes to keep the economy strong during Covid, now the markets are paying that price. The head scratcher for me is how long it took the Fed to reverse its course but at least now we can begin to get to normalized rates which is a net positive for all markets.

As I look at the current technical shape of the aforementioned indexes, it’s not a pretty sight. The Dow Jones Industrial Average (see chart here), the S&P 500 (see chart here) and the Nasdaq Composite (see chart here) are at or below their 52-week lows with no technical support yet in sight. The small-cap Russell 2000 (see chart here) is near its 52-week low but does have a bit of support right here. I think we could continue to see some more selling pressure before it’s all said and done but if you are a long-term holder of equities these type of market conditions can create some great opportunities too.

Good luck to all πŸ™‚

~George

No Surprise Here…

It’s no surprise here that the month of August was weak for the overall stock market. Despite the current economic backdrop historically August tends to underperform compared to the rest of the year. The Dow Jones Industrial Average (see chart here) last month closed down over 1000 points and the S&P 500 (see chart here) closed below the 4000 mark. The Nasdaq Composite (see chart here) gave up over 500 points and the small-cap Russell 2000 (see chart here) pulled back slightly. That being said and considering the current headwinds we are facing I believe stocks held up pretty well.

Now that we are in September and from a seasonal perspective especially with mid-terms approaching, I anticipate volatility to continue. There is also a possibility that vol will accelerate. Looking at the current backdrop, we have a Federal Reserve that continues to raise interest rates, corporate earnings are stagnating and the political situation in our country is nothing to be proud of now. Taking all of these factors into consideration, plus the constant flow of negative news, August could off sold off a lot more. Out of all these dynamics I prefer to tune out most all of the noise and really study how the Federal Reserve is navigating itself through this cycle. To me it is this entity that swings the biggest bat on how the markets move. As you know by now, I also pay attention to the technical shape of the key indexes.

Speaking of the technical shape of the market, let’s take a look. The Dow Jones Industrial Average (see chart here) is trading below its 20 day, 100 and 200 day moving averages. The S&P 500 (see chart here) is also experiencing a technically weak pattern as is the Nasdaq Composite (see chart here) and the Russell 2000 (see chart here). Again, no surprise here but I did notice the markets today appeared to find some support. For the markets the dog days of summer are almost over, but I think we all need to buckle up between now and the mid-terms because I do expect volatility to continue.

Good luck to all and have a great and safe Labor Day Holiday!

~George

What A Month For Stocks!

What a month for stocks as the major averages rebounded sharply in July. After witnessing an incessant selloff over the past few months, July turned out to be the best month for stocks in years. After falling into bear market territory, the S&P 500 (see chart here) gained almost 10% last month cutting its year to date losses in dramatic fashion. As I look at the Dow Jones Industrial Average (see chart here) a thousand-point gain in the last week or so is not too shabby either. Last but not least, both the Nasdaq Composite (see chart here) and the small-cap Russell 2000 (see chart here) also has enjoyed a strong recovery from their recent lows.

So why was there such a strong performance in the month of July? Q2 earnings reporting season is in full swing and at best this Q2 earnings so far have been a mixed bag. The Fed last week also raised interest rates another 0.75%. Inflation remains at or near 40-year highs. So, if you solely look at these metrics one would think the recent selloff would be accelerating. Clearly this is not the case, yet! The bears would argue that this is an “oversold” bounce and part of me agrees with that. However, I think it is too early to say that we are back to a full-fledged bull market. I do think if the markets remain stable over the next couple of months this could be a sign of a bottoming process. Let’s see how the rest of the summer plays out.

Now let’s move over to the technical shape of the aforementioned indexes. What has caught my eye is how the major averages are either at or have recaptured their 100-day moving average. This important support and/or resistance line is key as to whether stocks will pause into the resistance that moving averages experience, or if the momentum continues, then this could mean that this latest bull run will continue.

Good luck to all πŸ™‚

~George