What Bear Market?

The major averages in December entered into bear market territory and seemingly was heading even lower. But lo and behold and fast forward to today and we see that the key indices have all come roaring back.  The definition of a “bear market” is when a stock or an index goes down 20% or more from its highs and that was definitely the case in the second half of 2018. The Dow Jones Industrial (see chart here) is now back over 24,000 after dropping below 22,000 in December, the S&P 500 (see chart here) is back over 2,600 after dropping below 2,400, the Nasdaq Composite (see chart here) is now over 7,100 after hitting a low of 6,190 and the small-cap Russell 2000 (see chart here) it trading above 1,400 after hitting a low in December of 1,267.

The sharp V shaped bounce back in such a short period of time is very impressive. I do not think anyone expected such a sharp rebound in just a month. This surprise move is also happening despite the ever increasing chaos and turmoil out of Washington DC. Is it me or has it gotten to the point of utter disgust with what is happening to our country. I am not much of a political advocate in either direction but the narcissism and antics coming out of DC is unbelievable. What’s more is that they are using the government shutdown as the pawn to get their way, again unbelievable.

Ok enough of that and back to the markets. We are now heading straight into earnings reporting season and to me this without a doubt will be a significant catalyst as to whether or not stocks will continue to rise or pause. Of course any type of meaningful progress with the trade war and China could also play a major role. The Federal Reserve has been more vocal with interest rates and indicating that they are more apt to more of a wait and see approach as to any additional rate hikes in near term. There is a lot at hand here which should determine whether or not this bounce back rally will continue. Good luck to all 🙂

~George
What August Swoon?

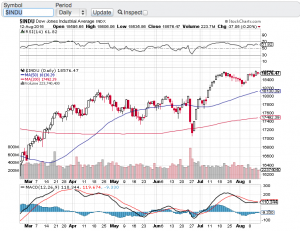
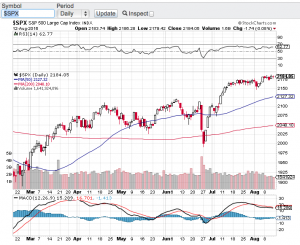
Actually quite the contrary! In fact new all time highs occurred this past week with the S&P 500 (see chart below), the Dow Jones Industrial Average (see chart below) and the Nasdaq (chart, click here). What’s more is these record closing highs of the aforementioned indexes occurred on the same day last week, a feat that has not happened since the bubble of 2000. Now I am not suggesting we are in a bubble like we were in dot-com days. Back then valuations of dot-com stocks and most of technology were rather insane. That said, the current price to earnings ratio of the S&P 500 is in the 20’s which is historically high. That alone could be a catalyst for a pause and consolidation and/or a pullback from the record high territory we have been trading in.

I am almost frightened to think or suggest that a retracement of any type is forthcoming simply due to the way the markets have been trading in a typically weak market season. As mentioned in my previous blog, August tends to be one of the weakest months of the year for the stock market. There is still a couple of weeks left in August and it is not too late to see historic trends surface. However, the way stocks have traded lately and with no real economic or geopolitical catalysts in the foreseeable future, this market melt-up may indeed continue.

Technically speaking, the trend lines of the 20-day, 50-day and 200-day moving averages all remain in tact and are yielding upward and the relative strength index of the key averages are not officially in overbought territory. So this is enough for me to not really expect much out of the market in either direction as we head into Labor Day weekend and as the summer winds down. Good luck to all 🙂

~George

S&P chart george mahfouz jr

dow jones chart george mahfouz jr

What A Rollercoaster Ride!

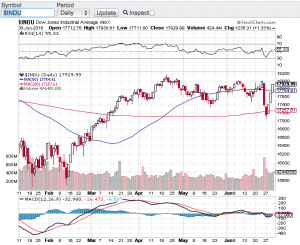
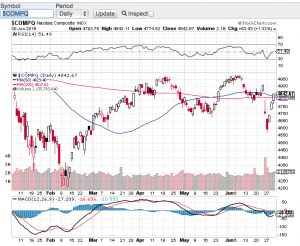
This week started off with the vote no one expected. Global markets were shocked with the outcome of the United Kingdom’s vote to the leave the European Union. Here at home, the Dow Jones Industrial Average (see chart below) lost close to 1,000 points between Monday and Tuesday, the Nasdaq (see chart below) over that same two-day period lost close to seven percent as did the S&P 500 (chart) and the small-cap Russell 2000 (chart). A breathtaking 2-day drop which was so swift and profound that it violated the 200-day moving averages of all of the aforementioned indexes. Fast forward to today and what seemingly was the start of an angry correction, has turned into yet another “buy the dip” opportunity. No matter what the challenges are or have been on the macro-economic or political front, markets over the past several years have shrugged them off. I honestly did not think stocks would snap back this time as quickly and as powerfully as they have.

Yet again, oversold conditions created a trader’s dream with this snap-back rally. Ever since this bull market began, every shocking or unexpected headline which have rattled the markets have always been met with strong support that then turns into the resumption of this protracted bull market. However, it is also very clear that we have been trading in a range for quite some time now and every time we have tried to breakout of this trading range, resistance is met and we retrace back to a variety of moving averages.

So you may be asking how do we break out of this S&P 500 (chart) 2000 to 2120 trading range? One catalyst that can do this is the upcoming second quarter earnings reporting season which kicks off here in July. I do not think that the economy is such that record earnings results will come forward. In fact, companies may take it upon themselves to use the Brexit circumstance to soften their future guidance? We will see. In my humble opinion I think the possibility of a downward break is more probable in the near term than stocks breaking out to all-time highs, especially after this snap back rally. Good luck to all!

Paula and I wish everyone a safe and Happy 4th of July holiday 🙂

~George Mahfouz, Jr.
Dow Jones George Mahfouz JrNasdaq George Mahfouz Jr.