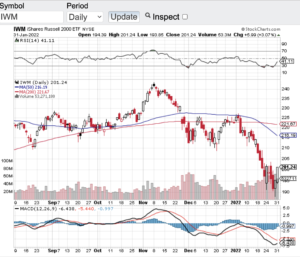
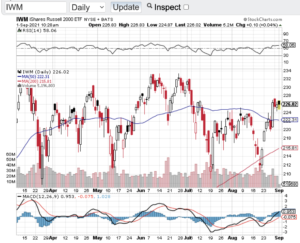
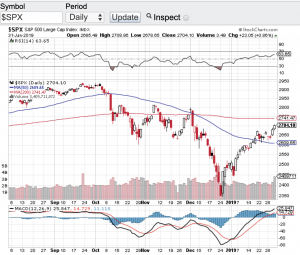
After breaching their respective 200-day support lines in March, the major averages appear to be breaking out of their months long trading range. The Dow Jones Industrial Average (see chart here), the S&P 500 (see chart here), the Nasdaq Composite (see chart here) and the small-cap Russell 2000 (see chart here) are all hitting monthly highs. Also, each of these indices appear to have strong momentum heading into July.
So why are the rally caps on? I think one of the drivers to this latest rally is how economy is faring. From the most recent GDP (gross domestic product report ) coming out stronger than expected to how inflation appears to be abating. Most every pundit expects our country to head into a recession, however, economic reports such as cited above are currently demonstrating a different backdrop. Market expectations have kept stocks in a trading range for the past several months until now.
The question now becomes is this a true “breakout” or is it a fake out? One catalyst that could answer this question is the upcoming Q2 earnings reporting season. Now that the second quarter of the year are in the books, corporate America will begin to report their Q2 earnings results here in July. This to me could prove whether or not this rally has more room to run.
When I look at the technical shape of the key indexes we are not yet in overbought territory according to the relative strength index aka the RSI. The only index that is near the 70-value level of the RSI is the S&P 500. According to the principles of the RSI, any index, stock, commodity etc. that trades above the 70 value of the RSI is considered overbought and we are not there yet. However, if this current rally continues then we could see the aforementioned indexes go into overbought territory. If this is the case, remember stocks and indexes can remain overbought for an extended period before reversion to the mean occurs.
Wishing everyone a safe and great 4th of July holiday weekend.
~George


