No Surprise Here…

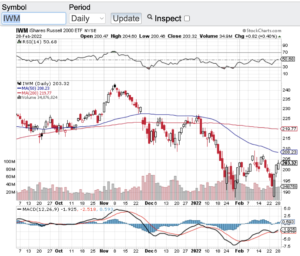
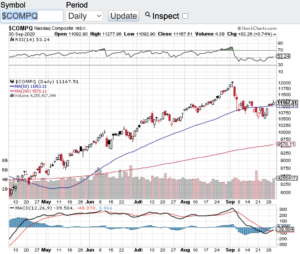
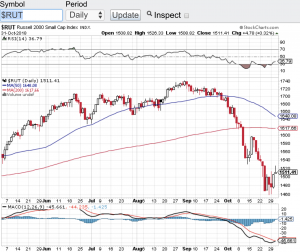
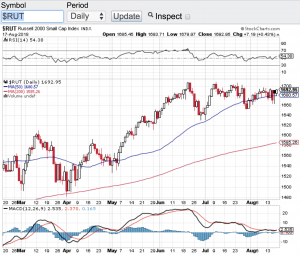
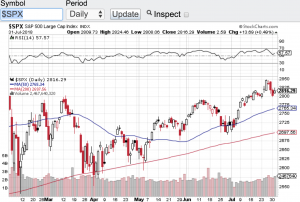
It’s no surprise here that the month of August was weak for the overall stock market. Despite the current economic backdrop historically August tends to underperform compared to the rest of the year. The Dow Jones Industrial Average (see chart here) last month closed down over 1000 points and the S&P 500 (see chart here) closed below the 4000 mark. The Nasdaq Composite (see chart here) gave up over 500 points and the small-cap Russell 2000 (see chart here) pulled back slightly. That being said and considering the current headwinds we are facing I believe stocks held up pretty well.

Now that we are in September and from a seasonal perspective especially with mid-terms approaching, I anticipate volatility to continue. There is also a possibility that vol will accelerate. Looking at the current backdrop, we have a Federal Reserve that continues to raise interest rates, corporate earnings are stagnating and the political situation in our country is nothing to be proud of now. Taking all of these factors into consideration, plus the constant flow of negative news, August could off sold off a lot more. Out of all these dynamics I prefer to tune out most all of the noise and really study how the Federal Reserve is navigating itself through this cycle. To me it is this entity that swings the biggest bat on how the markets move. As you know by now, I also pay attention to the technical shape of the key indexes.

Speaking of the technical shape of the market, let’s take a look. The Dow Jones Industrial Average (see chart here) is trading below its 20 day, 100 and 200 day moving averages. The S&P 500 (see chart here) is also experiencing a technically weak pattern as is the Nasdaq Composite (see chart here) and the Russell 2000 (see chart here). Again, no surprise here but I did notice the markets today appeared to find some support. For the markets the dog days of summer are almost over, but I think we all need to buckle up between now and the mid-terms because I do expect volatility to continue.

Good luck to all and have a great and safe Labor Day Holiday!

~George

Volatility Hits The Markets…

Volatility has hit the markets to the point that the VIX (see chart here) aka the fear gage has broken out. Stocks have been on a tear as of late but unfortunately to the downside. No one is surprised that the markets have become extremely volatile due to the Russian invasion of Ukraine. The Dow Jones Industrial Average (see chart here) fell over 10% since the crisis began as has the S&P 500 (see chart here). Both the Nasdaq Composite (see chart here) and the small-cap Russell 2000 (see chart here and below) have sold off closer to 15% before bouncing off of their sell-off lows. Again, no surprise that vol has spiked to almost a double over the past few weeks as tensions increased.

Before we get into the technical shape of the markets it’s hard for me to even talk stocks and indexes due to the atrocities happening abroad. Our prayers go out to everyone in the Ukraine that is being affected by this invasion and for the people of Russia who wants no part of this. Hopefully very soon a cease fire will happen and happen for good!

Now let’s look at the technical set-up that has occurred since the buildup and invasion with the aforementioned key indexes. Starting with the Dow Jones Industrial Average (see chart here). The Dow a few days ago hit a low of 32272 and has bounced to the 34,000 zone. There is much more work here to be done before the Dow can recapture its 100 and 200-day moving averages. The same can be said for the S&P 500 (see chart here) although with the S&P, it is closer to its 20-day M/A than the Dow Jones Industrials Average. Interestingly both the Nasdaq Composite (see chart here) and the small-cap Russell 2000 (see chart here) have bounced off of their recent lows stronger with the Russell 2000 recapturing its 20-day M/A. Despite the recent bounces off of their sell-off lows I think it is fair to say that we are not out of the woods yet in the volatility we have seen as of late. If you are a long-term investor, this will pass at some point in time. For experienced traders this is an environment where money can be made both on the long and short side of the markets. That said, I always recommend consulting your certified professional financial advisor(s) before making any moves in the backdrop we currently find ourselves.

Good luck to all πŸ™‚

~George

Volatility Hits The Markets - Paula Mahfouz

Stimulus Package Chatter Buoys Markets…

Yesterday, the lastest round of stimulus package chatter came out of Washington which helped buoy our markets. The Dow Jones Industrial Average (see chart here) closed the month of September out at 27781, the S&P 500 (see chart here) finished the month at 3363, the Nasdaq Composite (see chart below) closed at 11167 and the small-cap Russell 2000 (see chart here) finished at 1507. Although stocks had a strong close to end September, the month of September was a net negative for the markets. No question the uptick in COVID both here and abroad has put some pause to this bull market rally. Quite honestly, I think stocks have held up pretty well despite the ongoing pandemic and the constant tape bombs coming out of Washington.

Fast forward to today and we are now a month away from our Presidential election. I have got to believe that we are heading into more volatility than what we experienced in September. I think whoever watched the first Presidential debate would agree. In addition to the upcoming election, we are also heading right into Q3 earnings reporting season. Corporate America will be releasing their third quarter financial results over the next 45 days or so and that alone can create higher volatility. I am not sure what to expect when companies report their numbers and even more so how companies provide their forward looking guidance on their conference calls. Whatever the case is, I think it’s fair to say we will not be trading sideways here in the month of October.

Let’s take a gander at the technical shape of the aforementioned indexes. What has impressed me lately is how the Dow Jones Industrial Average (see chart here) found support near its 200-day moving average and more recently its 50-day moving average. The same can be said for the other major averages in how they too have found support at their respective moving averages. What’s more is these key indices are no where near overbought territory according to the relative strength index aka the RSI. So from a technical analysis standpoint, the markets look to be on solid footing.

Good luck to all πŸ™‚

~George

Stimulus Package Chatter Buoy Markets - Paula Mahfouz

A Long Overdue Correction!

It was a spooky time for the equity markets in October as stocks experienced a long overdue correction. You have to go back seven years to have a month that sold off in the way the markets behaved in October. Yes, historically October has been one of the most volatile months of the year. The problem with historical data over the past several years is most of the time history has NOT repeated itself. Stocks have been on a tear for years breaking record after record. In fact not that long ago all of the major indexes had set all time record highs. Fast forward to today and we find the Dow Jones Industrial Average (chart) down almost 7% from its recent all-time high, the S&P 500 (chart) actually fell at one point over 10% from its all-time high finishing the month of October down 8%, the Nasdaq Composite (chart)Β  is down over 10% from its recent all-time high and the small-cap Russell 2000 (see chart below) is off over 13% from its all-time high recorded on August 31st of this year. So I think it is safe to say most of the market is in correction mode.

Next question, is this a healthy correction for the markets and will stocks find their bottom here or could this be the start of our first bear market in a decade? I guess the answer depends upon who you ask. I think it is too early to call out that a bear market is in the making, but one thing is for sure, we have not seen sustained volatility as we have witnessed recently in a very long time. As long as the trade war rhetoric continues to spew out of Washington and as long as the Federal Reserve keeps its foot on the gas pertaining to interest rates, I think the wild swings and volatility will continue. Oh yea, there is also this small event next week called the “mid-term elections” which should also play a key role in continuing vol. Good luck to all πŸ™‚

~George

Russell 2000 - Paula Mahfouz

Trading Between The Lines…

Trading between the lines is how this August is playing out so far. In what is supposed to be a seasonal volatile period, August seemingly has been playing right to the tune of this almost decade long bull market. The Dow Jones Industrial Average (chart), the S&P 500 (chart), the Nasdaq Composite (see chart) and the small-cap Russell 2000 (see chart below) to my surprise have all traded in a tight range this month. Furthermore, the 20-day moving average and even more so the 50-day moving average have played a major role in supporting the indexes whenever any selling does come in. Now we have had a couple days here in August where it looked like these support lines would be breached and in fact in some instances they were. However, whenever these support lines were touched or breached, buying came right in and placed a floor beneath the selling pressure.

I am not sure how the rest of the month will play out but August at least from a seasonality perspective still has the potential to demonstrate volatility and experience meaningful selling pressure. I really do believe that the bear camp expected to see August as their month, but from the looks of things the bears may have to wait until September or beyond. Corporate earnings for the most part have been topping expectations, the economy is seemingly firing on all cylinders and rising interest rates are not that big of a factor yet to be weighing heavily on stocks.

My plan for the rest of the month is simple. Pay attention to the support and resistance zones of the aforementioned indexes and for that matter any stock that I am considering to trade. Secondly, I need to see the trading volume pick up before any definitive trend can be trusted. The market volume just has not been here this month which is also typical of the dog days of summer. Patience is the keyword between now and month end. That said, I expect after the labor day holiday we will be having a much different conversation. Good luck to all πŸ™‚

~George

Russell 2000 - Paula Mahfouz

Did Apple Just Save Tech?

Tech stocks have been battered lately but as in the past Apple just might of saved tech stocks, at least for the time being. After the close, Apple reported an astonishing $53 billion in revenues growing at a 17% clip. What’s more is Apple’s profits rose more than 30% coming in at a whopping $11.5 billion in profits. I thought there is a thing called the law of large numbers? Apparently not at Apple! People don’t realize how hard it is to grow a company of this size in the way Apple continues to grow. Year after year, quarter after quarter, simply amazing. The question now becomes is yesterday’s earnings beat by Apple enough to put a floor in tech stocks. Technology stocks have been taken out to the woodshed as of late with seemingly no end in sight, until yesterday. What I will be looking for today and for the rest of the week is whether or not companies continue get sold off after their earnings release which has been the trend this particular earnings reporting season.

In my last blog I eluded to the possibility of a breakout of the S&P 500 (chart) or a triple top fade in the index.Β  Quite honestly neither really happened, at least not yet. The S&P 500 (see chart below) essentially has been trading in a range between 2800 and 2850. Earnings reporting season has yet to be the catalyst for such a breakout or breakdown for that matter. Triple tops are very powerful to the technical set-up on any given index or stock for that matter. Apple’s earnings could very well be the catalyst for the markets to once again challenge the current triple top formation. Now that we are in August I do think we will get that answer soon enough. I do expect volatility to pick up a bit here in August which is not uncommon for this time of year. The SPY’s (chart) which tracks the S&P 500 (chart) has demonstrated support at its 20-day moving average which is essentially $279.50 and the overhead resistance is essentially the $285.00 zone. Let’s see if the S&P can break away from either line. Good luck to all πŸ™‚

~George

S&P 500 - George Mahfouz Jr.

Triple Top Or Breakout?

After chopping between the 2700 and 2800 zone for the past couple of months, is the S&P 500 (chart) at a triple top, or is it ready to breakout? I think we are going to find out this week in which second quarter earnings reporting season kicks into high gear. Although volatility has reared its head in first half of 2018, vol now has come back to what the markets have been accustomed to over the past few years (see chart below). Whether we breakout and test all time highs is a head scratcher. Of course earnings will play a key role in which way the markets will go, but there are other market moving factors in the mix. Any minute President Trump could put out a tweet on trade which could kill the most recent rally in stocks or propel it to new highs. On Tuesday and Wednesday, Federal Reserve Chairman Jerome Powell will speak in front of the Senate Banking Committee and the House Financial Services Committee. Without a doubt investors will be paying close attention to the tone and context of Chairman Powell’s testimony in front of both committees. Oh yes, we must not forget the Trump/Putin summit and I can’t even guess what comes out of that meeting and how the markets will react. So as you can see, chance are we will breakout of the triple top we are in or pullback within the trading range as mentioned above.

This week kicks off with high flying Netflix (NasdaqGS:NFLX) which reports their quarterly results tomorrow after the close, followed by Goldman Sachs (NYSE: GS) on Tuesday along with Johnson & Johnson (NYSE: JNJ), T-Mobile (NYSE: TMUS) and rounding the week out we will hear from the likes of Alcoa Corp (NYSE: AA), American Express (NYSE: AXP), eBay Inc. (NasdaqGS: EBAY), International Business Machines (NYSE: IBM), Etrade Financial Corp. (NasdaqGS: ETFC), Intuitive Surgical (NasdaqGS: ISRG), Microsoft Corp. (NasdaqGS: MSFT), General Electric (NYSE: GE) and Honeywell International Inc. (NYSE: HON) just to name a few. Good luck to all πŸ™‚

~George

VIX - George Mahfouz Jr.

Stocks In Whipsaw Action!

Volatility makes a comeback as stocks get whipsawed to end the month. The Dow Jones Industrial Average (chart) closed out the month of February with a 380 point loss, the S&P 500 (chart) retraced 30 points, the Nasdaq Composite (chart) dropped 57 points and the small-cap Russell 2000 (chart) closed the last day of February down 24 points. This two-day pull back comes off the heals of a sharp V shape bounce from the market correction that occurred in early February. During the bounce off of the most recent bottom it sure started to feel like the good ole days of lower vol and melt up mode. Not this time and at least not yet. What was abnormal was how volatility was virtually non existent over the past few years. Seemingly passive investing was the only place to be and in hindsight that was indeed the only place to be. During the multi-year melt-up we watched hedge funds underperform and in some instances close shop. There was simply no volatility for hedge funds hedge. It was a one way ticket up.

So what has changed you may ask? I think it is safe to say that the shift in the Federal Reserve’s policy albeit a delicate one is as far as you have to look. Since the financial crisis of 2008, the Federal Reserve has provided its entire war chest of financial accommodation to get the economy and banking system not only of its feet, but thriving again. So now that all systems are a go the Fed is unwinding its balance sheet and raising interest rates. Yes that sounds like a pretty simple answer but it’s also pretty clear to see. With that being said, I do not expect the Federal Reserve to act too quickly unless inflation abruptly takes off. In the meantime I believe volatility will be remain prominent in the marketplace which is putting a smile on traders faces and creating opportunity both long and short. πŸ™‚ Good luck to all!

~George

Finally A Tradable Market!

After years of essentially low to no volatility, traders finally get what they have been wishing for and that is a tradable market! In 2017 the markets witnessed the longest stretch of low vol in recent memory. In fact the VIX (see chart below) which is the ticker symbol for the Chicago Board Options Exchange volatility index traded in the 10 zone for most of 2017. The 10 level on the VIX (chart) is beyond abnormally low especially lasting for the better part of a year. Fast forward to today and the VIX is hovering around 20 after spiking to over 50 over the past two weeks. We haven’t seen the VIX (chart) at the 50 level in years. Call it long overdue, call it the market needed to correct, call it higher interest rates, call it what you want but finally we seemingly have more of a normal market environment. Not to say it wasn’t gut wrenching watching 1000 point Dow Jones Industrial Average (chart) intra-day swings over the past couple of weeks compared to the slow melt-up investors have enjoyed for years. Traders on the other hand have underperformed the markets during the melt-up because there simply was not enough or no volatility to be able to trade.

Stocks have indeed bounced sharply from the early February market correction. The Dow Jones Industrial Average (chart) closed the day up 307 points, the tech focused Nasdaq Composite (chart) closed up on the day 113 points, the S&P 500 (chart) closed up 32.5 points and the small-cap Russell 2000 (chart) finished the trading session up 15 points. Going forward I am certainly going to respect the technical make up of the aforementioned indexes and select stocks. Moving averages such as the 20-day, 50-day and 200-day tend to provide reliable support and resistance marks and now that we are out of the no vol environment, these moving averages tend to be more accurate and can be used to determined entries and exits in positions you hold and or trade. As I write this blog the key indexes have now rebounded to their 50-day moving averages so we will see if this technical indicator will act as resistance or if the markets can hold, breakthrough and proceed higher. Of course there is much more to consider when entering or exiting any position or strategy but when volatility comes back into the markets, most professional traders key in on the moving averages. Good luck to all πŸ™‚

~George

VIX - Paula Mahfouz

An Earnings Bonanza!

Earnings reporting season is now in full swing and so far the numbers are not too shabby. A couple of earnings standouts so far are Netflix (NasdaqGS: NFLX) and Boeing (NYSE: BA). Netflix saw subscriber and revenue growth both exceed analyst’s expectations and their stock has skyrocketed since their earnings release last week. Boeing which reported before the bell yesterday also knocked the cover off the ball as the company nearly doubled its net income from the prior period a year ago. A company doubling its net income may not sound like a lot, but when you go from $1.63B in net income to $3.13B that is clearly moving the needle in a fascinating way. Boeing shareholders were also rewarded yesterday as the stock traded north of $350.00 per share hitting all-time highs. I am just highlighting a couple of standouts so far with hundreds of companies set to report over the coming days and throughout the next few weeks.

After a 2 day mini sell-off to start the week the key indexes did bounce back yesterday and resumed itsΒ  uptrend. The Dow Jones Industrial AverageΒ (chart) closed the month of January above 26,000, the S&P 500 (chart) closed out the month at 2823.81, the Nasdaq Composite (chart) closed at 7411.48 and the small-cap Russell 2000 (chart) closed at 1575. Even with the first noticeable sell-off earlier in the week the aforementioned indexes did have a stellar performance in January gaining more than 5% on the month.

I will say this, earlier in the week and for the first time in almost 2 years the market did feel vulnerable and the sell-off felt a bit different than recent pullbacks. Pundits are suggesting that interest rates may be playing a role in the volatility for the first time in years. I have been tracking the yield on the U.S. 10 year Treasury Note (Symbol: TNX) and for the first time in a long time the yield exceeded 2.7%. A break above 3% for an extended period of time could cause volatility to continue in stocks and may be the very first catalyst to put the brakes on this almost decade long bull run. Let’s see how the rest of earnings reporting season plays out and how interest rates fare in February before we can draw any type of conclusion. Good luck to all πŸ™‚

~George