Rate Hikes Are Looming…

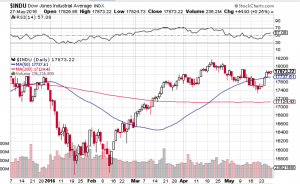
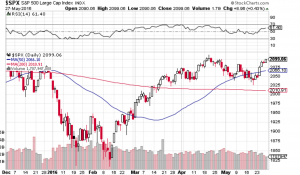
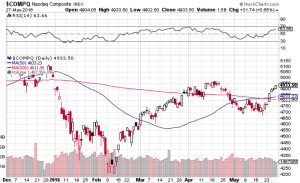
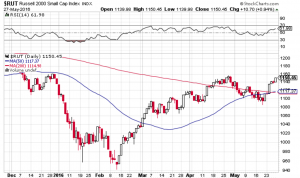
Janet Yellen the chair of the Federal Reserve last Friday signaled that the Federal Reserve is prepared to raise interest rates in the coming months should the U.S. economy continue to improve. Some pundits suggest that a rate hike could come at the Fed’s next policy meeting in two weeks. Despite the rate hike chatter, the markets continue to shrug off what seemingly could be bearish for stocks. The Dow Jones Industrial Average (see chart below) is within striking distance of all time highs. Same can be said for the S&P 500 (see chart below), the Nasdaq (see chart below) finds itself flirting once again with the 5000 mark and the small-cap Russell 2000 (see chart below) appears to have caught a bid and is strengthening.

This type of market activity is counterintuitive when interest rates appear to be heading north. The flip side to this thinking is if the Federal Reserve is willing to raise rates due to a stronger economic back-drop, one can assume that this must be good for corporate America. Logically speaking I agree, however, if history has anything to do with the markets, a rising interest rate environment typically does not bode well for equities. Couple this with the seasonality of the summer months which tend to be weaker months for stocks and the upcoming fall presidential election, and I would say at the very least we will see a rise in volatility. These are very powerful forces that are lining up and I think it’s safe to say the markets will be very reactive to these events.

So what’s a trader or investor do in this landscape? For me personally I think the type of environment we are heading into creates opportunity on the long and short side. I will be paying close attention to overbought and oversold conditions of the markets and select equities throughout the summer and into the fall. As everyone knows by now my favorite technical indicator when it comes to spotting overbought/oversold conditions is the Relative Strength Index also known as the RSI. Many market technicians also favor this technical indicator when assessing market conditions from a technical standpoint. Over the years the RSI has demonstrated its usefulness and if you are not familiar with this technical indicator, you may want to research it out. Click here for starters.

Both Paula and I wish everyone a very safe, prosperous investing and trading summer 🙂

~George Mahfouz, Jr.

Screen Shot 2016-05-30 at 8.00.40 PMGeorge Mahfouz Jr. S&P 500 chartGeorge Mahfouz Jr. Nasdaq ChartGeorge Mahfouz Jr. Russell 2000 Chart


Volatility Wakes Up!

After weeks of tepid volatility (chart)  investors and markets appear a bit jittery with volatility waking up. For the week, the Dow Jones Industrial Average (chart) closed down 1.3%, the tech-focused Nasdaq (chart) closed off 2.7%, the S&P 500 (chart) closed lower by 1.3% and the small-cap Russell 2000 (chart) finished lower on the week by 1.4%. As first quarter earnings reporting season begins to wind down with overall results coming in mixed, we now enter a time of year where weakness in stocks can occur with volatility even more prevalent. The old adage “sell in May and go away” could come into play.

The currents risks to the market as I see it is the market itself as valuations are historically high with the S&P 500 price to earnings ratio trading in the 20’s. Another risk to stocks is the possibility of the Fed raising rates in June.  These catalysts alone could be all that it takes for equities to not only pause but to continue to experience increased volatility as we head into the summer months. So now let’s look at the technical shape of the aforementioned indexes. After trading near or in overbought territory for the past month or so the Dow Jones Industrial Average (chart) broke through its 20-day moving average, the S&P 500 (chart) also broke through its 20-day moving average, however, a bit more troublesome is the Nasdaq (chart)  as it has broke through its 200-day moving average this past week, a moving average that is more closely watched. Finally, the small-cap Russell 2000 (chart) is now sitting right at its 20-day and 200-day moving averages. So the technical shape of the markets at least according to moving averages support lines appear to be breaking down a bit.

So as we head into a typically softer time for equities that is May and June, and considering the current technical shape of the markets, both Paula and I feel it would be best to move to the sidelines and see if the current increase in volatility continues or if this is just a pause in the sharp rally we have seen since the middle of February.

Good luck to all 🙂

~George

A Respite From The Sell-Off!

Stocks snapped back sharply on Friday after a week of relentless selling pressure. On Friday the Dow Jones Industrial Average (chart), surged 313.66 points, the Nasdaq (chart) popped 70.67 points, the S&P 500 (chart) notched a gain of 35.70 points and the small-cap Russell 2000 (chart) closed Friday out up 18.27 points. For most of last week the markets were under tremendous pressure as oil continued to plummet along with bank stocks. On Thursday U.S. crude oil closed at a 13-year low only to snap back on Friday gaining over 12%. One of the reasons why oil has bounced off of multi-year lows is a rumor was floating around that the Organization of Petroleum Exporting Countries aka O.P.E.C. was prepared to cut production. We will see if this becomes the case. Furthermore, the European banks have been sold off ruthlessly all year long which has indeed carried over to our banks here at home. So when you have both oil and banks selling off the way that they have, it’s no wonder why there has been a global sell-off sending markets into correction territory.

As the global sell-off continues and as the chatter of doomsday gets louder and louder, I think it is important to remember that we have been in one of the strongest and longest bull markets of all time. Let’s not forget it is not only normal but quite healthy that stocks, bonds and commodities correct and balance out. It amazes me that when sell-offs occur that lead to corrections in the marketplace how the pundits come out of the woodwork and speak to how the world is coming to an end. My friends, what hasn’t been normal is for over six years how we have not had a market correction of over 10% that has stuck. Well here we are today and this is where we find ourselves.

Yes, equities can go lower and yes it can get more painful. But once valuations become attractive again and this is what market corrections provide, you better believe at some point in time buyers will resurface and take advantage of the what goes on sale. The markets are closed on Monday due to Presidents’ Day. Both Paula and I wish everyone a very safe and happy holiday 🙂

~George


Happy New Year!

2015 essentially proved to be a flat to down year for stocks taking some investors and traders by surprise. The Dow Jones Industrial Average (chart) closed the year down 2.2%, the S&P 500 (chart) minus dividends closed down just under 1%, the Nasdaq (chart) closed up 5.73% and the small-cap Russell 2000 (chart) closed the year down 5.71%. What’s more is how crude oil (chart) fared in 2015 declining more than 30% which also had weighed heavily on the aforementioned indices.

Looking ahead to this year, stocks find themselves in a place where they haven’t been in quite sometime and that is a rising interest rate environment. Historically speaking, equities tend to be under pressure at the beginning of and throughout a rate hike cycle with the exception of cyclical stocks and certain commodities. However this time may be different. In the past when the Federal Reserve begins to raise interest rates it is usually to fend off inflation and/or to cool off the economy when it becomes too hot. From my view and from the data flow, this is not the environment we find ourselves in today. So I do not expect that the Federal Reserve would raise rates aggressively or too quickly. With that said, the markets might not trade the way they would if we were in an inflationary environment with rising interest rates. Nonetheless, I do think that more volatility will come into stocks in 2016 and it will become more of a stock pickers market.

Furthermore, the technical shape of the market appears to be setting up for more downward movement as the key indexes have breached or are about to breach their respective 200-day moving averages. However, it would take days of trading below their 200-day to set off an alarm at least from a technical perspective. Let’s see how the first week of trading in the new year plays out before making any sort of definitive technical opinion.

Both Paula and I sincerely wish everyone the healthiest, happiest, safest and most prosperus New Year yet 🙂

~George

Finally The Fed Raises Rates!

After 9 years of essentiality zero percent interest rates, the Federal Reserve today raised its benchmark interest rate one quarter of one point. Investor’s embraced the Fed’s action lifting all of the key major averages. The Dow Jones Industrial Average (chart) closed up 224 points, the Nasdaq (chart) up 76 points, the S&P 500 (chart) up 29 points and the small-cap Russell 2000 (chart) closed out the session up 17 points. The street gained confidence when Fed officials also provided clarity as to their upcoming intentions regarding further rate hikes. Such hikes would only move up between 0.25% and 0.5% and would be subject to future economic activity and data. Another takeaway today is that the Federal Reserve has enough confidence in the current economy to raise rates and confidence in future growth in the foreseeable future. If you are bullish on the markets it doesn’t get better than this. Which is a tepid Federal Reserve while considering raising rates and an economic backdrop that seemingly is demonstrating growth albeit in a moderate manner.

So which sectors could benefit the most from a rising interest rate environment? One sector I will turn my attention to is the banking sector. Banks tend to earn more when rates move up simply because they can charge more interest on the loans they make. There are individual bank names that one can consider but for me personally I would rather position myself in the largest banking exchange traded fund (ETF) Symbol: XLF. The XLF’s top holdings include the likes of Wells Fargo & Company (NYSE: WFC), JP Morgan Chase (NYSE: JPM), Bank of America (NYSE: BAC) Citigroup (NYSE: C) and Goldman Sachs (NYSE: GS) just to name a few. So you get the diversity of multiple money center banks and other banking related institutions which spreads out some risk. That said, it is best practice to consult with your financial advisor(s) before making any investment decisions.

I do think that investors and traders alike can now breathe a sigh of relief now that the Fed has made its first move and the markets cheered that with enthusiasm. Good luck to all!

Both Paula and I wish everyone a very safe and happy holiday season 🙂

~George

Is It A Looming Rate Hike, Or Something Else?

After posting blistering gains in the month of October, stocks took it on the chin last week and it’s technically looking like more short-term downside could be in the cards. For the week, the Dow Jones Industrial Average (chart) lost 665 points, the Nasdaq (chart) retraced 219 points or 4.3%, the S&P 500 (chart) -76 points and the small-cap Russell 2000 (chart) closed lower on the week by 53 points or 4.4%.

Seemingly, the start of the selling pressure accelerated when the October labor report came out surprisingly strong. This report was released on November 6th. One could say that this is the main reason stocks have been under pressure. Pundits are now calling with almost certainty that the Federal Reserve has the green light to raise interest rates at their next meeting in December. Couple this will commodity prices continuing to fall, in particular oil, which is down recently almost 10% and you can understand why the markets would be under pressure. Or could it be the simple fact that October saw almost 10% gains across the board and the key indices were overdue for a pullback. I’d like to add to the mix that the latest round of economic numbers could also be weighing in on investor sentiment. This is evidenced by a weaker than expected retail sales number and weak retail earnings reports issued last week along with a very weak Producer Price Index. Sum all of this up and it’s no wonder the aforementioned indexes closed lower by almost five percent last week. From a technical perspective the key indexes have now breached their respective 200-day moving averages and if you are bullish, you would want to see the markets recapture this key technical support line and return to the uptrend that was intact throughout the month of October.

As the Thanksgiving Day holiday fast approaches, both Paula and I wish everyone a very safe, healthy and Happy Thanksgiving 🙂

~George

Staying True To Form…

In late September stocks appeared to be heading to new 52 week and multi-year lows. But as this market has demonstrated its resilience during this six year bull run, the four major averages found support near its previous lows in late August and have bounced nearly 10%. This most recent market action have yet again muzzled the bear pundits and revived the bulls hopes for a possible year-end rally. For the week the Dow Jones Industrial Average (chart) closed modestly higher up 131.48 points, the Nasdaq (chart) had a weekly gain of 56.22 points, the S&P 500 (chart) finished up 18.22 points and the small-cap Russell 2000 (chart) bucked the uptrend falling slightly by 3.05 points.

So could there be a year-end rally in the cards? I think the answer to that question will come forward as we are now kicking into high gear with Q3 earnings reporting season. Already this past week we heard from the likes of JPMorgan Chase (NYSE: JPM), Citigroup (NYSE: C), Goldman Sachs (NYSE: GS) and international conglomerate General Electric (NYSE: GE) who all provided results investors could cheer about. Each one of these companies notched impressive gains on the week not only helping the key indices, but also instilling confidence with investors. However, and as we all know, earnings reporting season can be volatile and we are at just at the starting gate.

Next week we will get quarterly results from technology giant Broadcom (NasdaqGS:BRCM), oil and gas equipment services behemoth Halliburton (NYSE: HAL), Bank of New York Mellon (NYSE: BK), Chipotle Mexican Grill (NYSE: CMG), Yahoo (NasdaqGS: YHOO), biotech giant Biogen (NasdaqGS: BIIB), Coca-Cola Co. (NYSE: KO), General Motors (NYSE: GM), Las Vegas Sands Corp. (NYSE: LVS), Amazon.com Inc. (NasdaqGS: AMZN), E*Trade Financial Corp. (NasdaqGS: ETFC), basic materials giant Freeport-McMoRan Inc. (NYSE: FCX), Microsoft (NasdaqGS: MSFT) and American Airlines Group Inc. (NasdaqGS: AAL) just to name a few.

These are only a handful of companies scheduled to report next week with hundreds more to follow in the coming weeks. That said, both Paula and I will continue to remain patient and wait until after earnings reporting season before we consider any new market strategies.

Good luck to all 🙂

~George

Finally The Bulls And Bears Got What They Wanted!

A Correction! After years of not having a 10% or more correction in the markets and with August tending to be one of the worst performing months for equities, this was the perfect set-up for the long overdue correction in stocks to take place. However, just as fast as the stock market correction occurred, the ensuing snap back rally was equally eye-poping. For the month, the Dow Jones Industrial Average (chart) fell 6.57%, the tech focused Nasdaq (chart) lost 6.86%, the S&P 500 (chart) -6.26% and in the month of August the small-cap Russell 2000 (chart) experienced a 6.45% decline. Last week we did witness very rare market behavior with whipsaw action not seen since the 2008 financial market crisis. This brought back memories of how stocks and financial markets can irrationally behave as emotions and high frequency trading take over.

The question now is, is this type of market volatility over? I don’t think so. Let’s first take a gander of the technical health of the four major averages. Without question, short term technical damage in these key indices have occurred. Each one of the index have fallen sharply and have closed below their respective 200-day moving averages. Furthermore, today at the open and for the first time in years, the S&P 500 (chart) will have its 50-day moving average crossover its 200-day moving average. Technically and historically speaking, this is not usually a good thing. The Dow Jones Industrial Average (chart) saw its 50-day crossover its 200-day in the middle of August only to experience exhaustive selling thereafter. The good news technically is that stocks had been way oversold to the point 0f capitulation. Hence, the ensuing sharp rally from the most recent lows.

So where do we go from here? I suspect that we will continue to experience outsized market moves in both directions and trading this kind of market environment is not for the feint of heart. I revert back to a more conservative approach starting with identifying the most current “best of breed” in their respective industries. The first prerequisite for me in identifying potential investment candidates in this type of market environment is for companies to have pristine balance sheets with little to no debt levels. However, if they do have debt they must have have historic and current cash flows that can easily service their debt. Without this and in today’s market I have no interest on really owning anything. Of course there are many other metrics that do apply but for me personally the balance sheet is where it begins. Another huge factor for me especially today is to implement disciplined  “protective stops” in any positions I hold. This ensures that your portfolio is somewhat protected should the markets decide that we are in the early innings of this correction. With that said and especially in today’s market, please consider consulting with a trusted certified financial planner(s) before making any additions or modifications to your own portfolio.

Both Paula and I wish everyone a very safe and Happy Labor Day holiday weekend 🙂

~George


It’s All About Greece…

The Greece Crisis is at the forefront of the markets yet again. Greece closed its banks and stock market on Monday in an attempt to avoid on run on their financial institutions. The heightened state of Greece sent our markets into a tailspin on Monday, however the U.S. stock market did find it’s footing yesterday managing to eek out a small gain. For the month of June, the Dow Jones Industrial Average (chart) closed down 391.18 points at 17,691.51, the Nasdaq (chart) finished the month lower by 83.16 points at 4987.00, the S&P 500 (chart) -44.29 points at 2063.11 and the small-cap Russell 2000 (chart) was one of the only major averages that finished the month of June positive closing up 7.42 points on the month at 1253.95.

So what’s in store for the month of July you may ask? One word, Volatility! Since the realization that Greece is going to miss its $1.7 billion dollar debt payment it owes to the International Monetary Fund and that Greece may no longer be a part of the European Union, volatility slammed the global markets. The $VIX (chart) which trades on the Chicago Board Options Exchange is the Volatility Index. The $VIX indicates the market’s expectation of future volatility, 30 days to be exact, spiked as high as 41% since Monday. We have not seen this type of vol for months and I don’t expect it to let up anytime soon.

Although Greece continues to grab the headlines, there are other concerns that contagion can spread to other debt ridden EU countries such as Spain and Portugal. Even Puerto Rico has it’s own debt issues that are of increasing concern. I do expect that there will be a resolution of some sort to this latest crisis, but I also do believe volatility will stick around for a bit.

Another catalyst that could create additional volatility is the upcoming Q2 earnings reporting season. U.S. companies will begin to report their results after the 4th of July holiday and in earnest the week thereafter. So you can see why I believe volatility could be increasing over the next several weeks. As a trader, this is what you have been waiting on and if you are a long term investor, you have been through this before.

Both Paula and I wish everyone a very safe and Happy 4th of July Holiday 🙂

~George

Record Closing High For The S&P 500!

Despite choppy trading for most of the week and weak economic data being released, the S&P 500 (chart) closed the week out at a record closing high of 2122.73. The Dow Jones Industrial Average (chart) is now only a mere 16 points away from its all-time high of 18,288.63, the Nasdaq (chart) appears to be closing in on its record high of 5119.83 and the small-cap Russell 2000 (chart) is attempting to claw its way back to record territory.

I thought you were supposed to “sell in May” and go away? Apparently not! However, I will say this, these records that are occurring are happening on lighter volume than I would want to see to validate the most recent price action. Nonetheless, you cannot deny the incessant strength that the markets are showing. Not less than two weeks ago it appeared that we might of been en route to the 10% correction or so that had been chattered up by the pundits. In early May, the S&P 500 (chart) had breached its 50-day moving average only to snap back and set a new record closing high yesterday.

Speaking of the moving averages, the aforementioned key indices are now comfortably trading above their 50-day moving averages with the exception of the small-cap Russell 2000 (chart). The Russell yesterday did closed right at its 50-day. We will see next week if this index can join the other major averages and reclaim its 50-day moving average and close in on its record high. Now let’s take a look at the Relative Strength Index which another favorite technical indicator of mine. The RSI is a technical indictor that demonstrates whether or not a index or stock is oversold or overbought, click here for the complete definition of the RSI. Even though we are at record highs, none of the major averages are in overbought territory according to the RSI. Add to the mix that next week will lead up to Memorial Day weekend and volumes should begin to decrease, I do not see any major catalyst that would interfere with the most recent upward trend of the market.

Speaking of Memorial Day, both Paula and I wish everyone an upcoming safe Memorial Day holiday weekend and let’s not ever forget all who had bravely served our country.

~George