First Half Of 2018 In The Books…

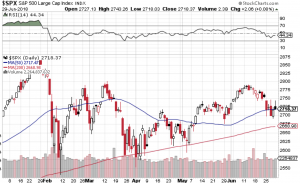
The first half of 2018 is in the books and where in the world did that go? Year to date the Dow Jones Industrial Average (chart) is off about one percent, the S&P 500 (see chart below) is up a couple of percentage points but the Nasdaq Composite (chart) and the small-cap Russell 2000 (chart) are way outperforming the other benchmark indexes closing the first half of the year up almost 10% each.

Let’s take a look how the second half of the year is shaping up. We start off the second half of the year with of course the fourth of July holiday which this year happens to be in the middle of the week. I don’t expect too much market action this upcoming week especially with a shortened trading session on Tuesday followed by the markets closing on Wednesday in recognition of the 4th of July. There could be some positioning going on both Thursday and Friday after the holiday. but all in all I am expecting lighter volume throughout the week with not too much volatility. Now the following week and the second half of the year is a whole different story. Q2 earnings reporting season will begin in earnest the week of July 9th and this my friends will be the true beginning of the second half of the trading year. I expect volatility to kick in once again as corporate America unveils their most recent quarterly results. Furthermore, we will be getting ever closer to the midterm elections that promises to be filled with about as much drama and rhetoric one can imagine. Also, historically stocks have witnessed meaningful corrections at some point during the year leading up to the midterms and I do not expect this year to be any different. I also expect corporate America to report impressive growth to their top and bottom lines; however, these results may already be priced in.

Technically speaking the aforementioned indexes all remain above their respective moving averages with the Dow Jones Industrial Average (chart) hovering right around its 200-day. Paula and I wish everyone a very safe and Happy 4th of July 🙂

~George
S&P 500 - Paula Mahfouz


Simply On Fire!

Stocks continue to set records and now on a daily basis! As I am writing this blog the Dow Jones Industrial Average (chart) is now trading north of 20440, the S&P 500 (chart) is trading well above 2300, the Nasdaq (chart) is trading above 5750 and the small-cap Russell 2000 (chart) set an all time high yesterday at 1398! I continue to be amazed on how resilient the markets have been and continue to be. Earlier this month it appeared that the Trump rally stalled out and it was becoming a wait and see environment. Well now the Trump rally has seemingly reignited. Trump last week announced he has major news forthcoming on his tax plan and that was apparently the cue for the markets to rally yet again. However, one has to ask how many more tweets, news conferences or headlines can take the markets higher? Without question the above key indices are becoming overbought and especially pertaining to the relative strength index also know as the RSI. Let’s take a look.

Currently the Dow Jones Industrial Average’s RSI (chart) is trading at a 73, the S&P 500 (chart) RSI is also currently at 73, the Nasdaq (chart) is even higher at 77. The only laggard pertaining to the relative strength index and being in an “overbought” condition is small-cap Russell 2000 (chart) in which its RSI is currently at the 60 value level. Remember the relative strength index is a widely utilized technical indicator that certain institutional traders include in their models along with a variety of algorithm trading platforms. The RSI is a momentum indicator that tracks the size of gains and losses over a given period of time with the 70 value level and above as overbought and the 30 value level and below as oversold. One of the concerns certain market technicians have is that these all time highs and overbought conditions have been occurring on relatively light volume. Without trying to call a top here, I suspect that the aforementioned indices and some of the overbought stocks within these indexes are due for a pullback.

Good luck to all and Paula and I wish everyone a Happy Valentine’s Day 🙂

~George


A Weak Week For Stocks…

Stocks closed out the final week of May on a softer note with the Dow Jones Industrial Average (chart) falling 221.34 points, the Nasdaq (chart) lost 19.33 points, the S&P 500 (chart) -18.67 points and the small-cap Russell 2000 (chart) closed the week lower by 5.69 points. Considering the record closing highs that have been set over the past month or so, its no surprise that equities took a bit of a breather.

Now that we are in the month of June, let’s see if this seemingly temporary pause turns into something more meaningful. The month of June historically is a unfavorable month for stocks and this year may be no different. In fact, in this trading week headline risks are abound. Internationally speaking, without a doubt Greece’s debt talks will continue to grab the attention of investors this week as well as the ECB’s central bank meeting. Here in the states, traders will continue to pay attention to the continuing strength of our dollar as well as May’s jobs report at the end of the week. As you can see there are plenty of catalysts that could become market moving events.

Technically speaking, the aforementioned indexes are finding support at their respective 50-day moving averages and none of these indices are in overbought or oversold territory according to the relative strength index (RSI). One technical point I do want to make is when stocks were setting records earlier in May, the volumes associated with those records were on the lighter side. As mentioned in my previous blog, my preference would of been to see these records being set with much stronger volume.

Have a great week and good luck in the month of June 🙂

~George

Record Closing High For The S&P 500!

Despite choppy trading for most of the week and weak economic data being released, the S&P 500 (chart) closed the week out at a record closing high of 2122.73. The Dow Jones Industrial Average (chart) is now only a mere 16 points away from its all-time high of 18,288.63, the Nasdaq (chart) appears to be closing in on its record high of 5119.83 and the small-cap Russell 2000 (chart) is attempting to claw its way back to record territory.

I thought you were supposed to “sell in May” and go away? Apparently not! However, I will say this, these records that are occurring are happening on lighter volume than I would want to see to validate the most recent price action. Nonetheless, you cannot deny the incessant strength that the markets are showing. Not less than two weeks ago it appeared that we might of been en route to the 10% correction or so that had been chattered up by the pundits. In early May, the S&P 500 (chart) had breached its 50-day moving average only to snap back and set a new record closing high yesterday.

Speaking of the moving averages, the aforementioned key indices are now comfortably trading above their 50-day moving averages with the exception of the small-cap Russell 2000 (chart). The Russell yesterday did closed right at its 50-day. We will see next week if this index can join the other major averages and reclaim its 50-day moving average and close in on its record high. Now let’s take a look at the Relative Strength Index which another favorite technical indicator of mine. The RSI is a technical indictor that demonstrates whether or not a index or stock is oversold or overbought, click here for the complete definition of the RSI. Even though we are at record highs, none of the major averages are in overbought territory according to the RSI. Add to the mix that next week will lead up to Memorial Day weekend and volumes should begin to decrease, I do not see any major catalyst that would interfere with the most recent upward trend of the market.

Speaking of Memorial Day, both Paula and I wish everyone an upcoming safe Memorial Day holiday weekend and let’s not ever forget all who had bravely served our country.

~George