Dow 40000, Now What?

Last month we witnessed the Dow trade above 40000 for the first time ever and now the question is, now what? Yes, that’s right, the Dow Jones Industrial Average (see chart here) eclipsed the 40000 marks for the first time in its history. I remember back in 1999 there was a book that I bought titled “Dow 40000” by David Elias. Mr. Elias predicted that the Dow would hit 40000 by the year 2016. Well, that might have been a bit too optimistic regarding the timeframe, but as we just witnessed, his prediction of Dow 40000 came true. For me as I read that book, the Dow was trading in the 10000 zone, and this was nearing the height of the dot-com boom. My view at that point in time was how in the world can the Dow Jones Industrial Average triple from here after it more than tripled during the dot-com boom. It took 25 years to do so and now the question on many investors’ minds is “has become was a short-or near-term top?” Based on how the Dow has responded after reaching that record high of 40000, it sure appears that way.

After topping 40000, the Dow Jones Industrial Average (see chart here and below) the Dow gave back 2000 points over the course of the next week or so and then on Friday bounced back to close at 38600 which is right at its 100-day moving average. The Dow wasn’t the only index to reach record heights. The Nasdaq Composite (see chart here) also hit an all-time high last month topping the 17000 mark, the S&P 500 (see chart here) hit an all-time high of 5346 while the small-cap Russell 2000 (see chart here) is seemingly locked in a trading zone between 1900 and 2100.

I remain in awe of the strength of the stock market despite all the headwinds our economy faces and with the geopolitical backdrop. We also cannot forget this is an election year like no other. To that end, I am expecting volatility to rear its head this summer and as we head into the fall.

Good luck to all 🙂

~George


Geopolitical Risks Abound…

Stocks closed the shortened holiday week down on Thursday as the U.S. dropped the largest non-nuclear bomb on a target in Afghanistan. This just after the U.S. launched tomahawk missiles targeting a Syrian airbase in response to a chemical attack on innocent civilians in Syria. Now North Korea is increasing its verbal threats of an all out war on the United States. What’s going on here? It’s hard to talk about stocks when all of this hatred is occurring around the world. Nonetheless, the markets will move forward but will be certainly affected by the troubling geopolitical environment and the uncertainties that exist in multiple regions around the globe.

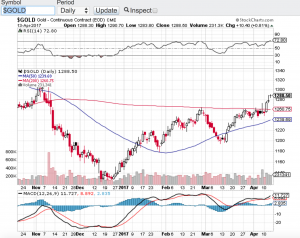
For the week, the Dow Jones Industrial Average (chart) closed down 1%, the S&P 500 (chart) closed off 1.19%, the Nasdaq (chart) -1.2% and the small-cap Russell 2000 (chart) finished the week lower by 1.39%. Gold (see chart below) was up on the week and for the first time since November of last year, closed above its 200-day moving average. This is no surprise due to what is currently going on in the world. The question now is how to trade this market environment or what to do with your current positions? If history repeats itself, market volatility should increase which is good for traders but can be unnerving to longer term investors. In fact volatility (chart) spiked this week to its highest level in 5 months.

Now that earnings reporting season is underway some market pundits are saying that this will dictate whether or not markets will continue higher or if earnings reporting season will be the catalyst to send stocks into correction mode. I disagree with this point of view. How can the markets concentrate on earnings reporting season when you have this widespread turmoil around the globe? Of course, earnings are what typically drive stocks and valuations but until the geopolitical back drop abates and a sense of resolve comes forward I will be ultra conservative in going long any equities unless it is gold or gold related assets. Of course it is always best to consult a certified financial planner(s) before making any investment decisions. Good luck to all and both Paula and I wish all a safe and Happy Easter weekend.

~George

gold chart george mahfouz jr

The Trump Rally Continues…

Caught off guard! I think this phrase wraps it up. After Donald Trump won the presidential election both voters and markets were caught off guard. The polls all but had Hillary as a shoe in for the oval office. Instead the exact opposite occurred not only with the election but how wrong the markets had it if Donald Trump pulled it off. Not only did the markets not crater, (although last Tuesday evening when the voting results were coming in the futures were tanking) stocks are back to setting records. Since the election, the Dow Jones Industrial Average (chart) hit an all-time high of 18,934, the S&P 500 (chart) is within striking distance of its all-time high, the small-cap Russell 2000 (chart) also hit an all-time high, however, the tech focused Nasdaq (chart) is lagging a bit due to the uncertainty of the new Trump administration policies on trade and how this could affect the technology space.

It has been quite a while since the markets have responded in such a bullish manner. Today marks the 7 straight day of gains for the Dow Jones Industrial Average (chart) led by industrials and banks. The banking index has exploded due to the hope that the Trump administration will relax or reverse the Dodd-Frank act which places overbearing regulations on the financial industry as a whole. Check out one of the most widely held bank exchange traded funds Symbol: XLF (chart). This ETF has moved up over 10% in the past week alone, simply unheard of. Other benefactors to the Trump presidency is anything and everything in infrastructure and materials. Trump pledges to spend over $1 trillion dollars rebuilding America’s infrastructure to include highways, roads, bridges, airports etc. It’s no wonder the markets are setting records once again.

Now what? Without question Trump winning the election is seemingly good the for the economy and so far for the stock market. However, as with any rally or sell-off for that matter, “reversion to the mean” typically occurs. I would be very careful chasing this rally or deploying any new capital. My preference is to wait until the inevitable pullbacks occur and look at the aforementioned sectors to consider any new positions. Of course it is always prudent to consult with a certified financial planner(s) before making any investment decisions. Good luck to all 🙂

~George

Happy New Year!

2015 essentially proved to be a flat to down year for stocks taking some investors and traders by surprise. The Dow Jones Industrial Average (chart) closed the year down 2.2%, the S&P 500 (chart) minus dividends closed down just under 1%, the Nasdaq (chart) closed up 5.73% and the small-cap Russell 2000 (chart) closed the year down 5.71%. What’s more is how crude oil (chart) fared in 2015 declining more than 30% which also had weighed heavily on the aforementioned indices.

Looking ahead to this year, stocks find themselves in a place where they haven’t been in quite sometime and that is a rising interest rate environment. Historically speaking, equities tend to be under pressure at the beginning of and throughout a rate hike cycle with the exception of cyclical stocks and certain commodities. However this time may be different. In the past when the Federal Reserve begins to raise interest rates it is usually to fend off inflation and/or to cool off the economy when it becomes too hot. From my view and from the data flow, this is not the environment we find ourselves in today. So I do not expect that the Federal Reserve would raise rates aggressively or too quickly. With that said, the markets might not trade the way they would if we were in an inflationary environment with rising interest rates. Nonetheless, I do think that more volatility will come into stocks in 2016 and it will become more of a stock pickers market.

Furthermore, the technical shape of the market appears to be setting up for more downward movement as the key indexes have breached or are about to breach their respective 200-day moving averages. However, it would take days of trading below their 200-day to set off an alarm at least from a technical perspective. Let’s see how the first week of trading in the new year plays out before making any sort of definitive technical opinion.

Both Paula and I sincerely wish everyone the healthiest, happiest, safest and most prosperus New Year yet 🙂

~George