Finally A Tradable Market!

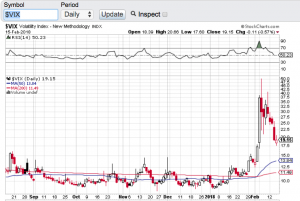
After years of essentially low to no volatility, traders finally get what they have been wishing for and that is a tradable market! In 2017 the markets witnessed the longest stretch of low vol in recent memory. In fact the VIX (see chart below) which is the ticker symbol for the Chicago Board Options Exchange volatility index traded in the 10 zone for most of 2017. The 10 level on the VIX (chart) is beyond abnormally low especially lasting for the better part of a year. Fast forward to today and the VIX is hovering around 20 after spiking to over 50 over the past two weeks. We haven’t seen the VIX (chart) at the 50 level in years. Call it long overdue, call it the market needed to correct, call it higher interest rates, call it what you want but finally we seemingly have more of a normal market environment. Not to say it wasn’t gut wrenching watching 1000 point Dow Jones Industrial Average (chart) intra-day swings over the past couple of weeks compared to the slow melt-up investors have enjoyed for years. Traders on the other hand have underperformed the markets during the melt-up because there simply was not enough or no volatility to be able to trade.

Stocks have indeed bounced sharply from the early February market correction. The Dow Jones Industrial Average (chart) closed the day up 307 points, the tech focused Nasdaq Composite (chart) closed up on the day 113 points, the S&P 500 (chart) closed up 32.5 points and the small-cap Russell 2000 (chart) finished the trading session up 15 points. Going forward I am certainly going to respect the technical make up of the aforementioned indexes and select stocks. Moving averages such as the 20-day, 50-day and 200-day tend to provide reliable support and resistance marks and now that we are out of the no vol environment, these moving averages tend to be more accurate and can be used to determined entries and exits in positions you hold and or trade. As I write this blog the key indexes have now rebounded to their 50-day moving averages so we will see if this technical indicator will act as resistance or if the markets can hold, breakthrough and proceed higher. Of course there is much more to consider when entering or exiting any position or strategy but when volatility comes back into the markets, most professional traders key in on the moving averages. Good luck to all 🙂

~George
VIX - Paula Mahfouz

As Promised, Vol Is Back!

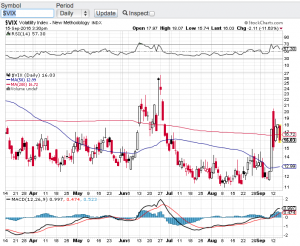
We knew it was only a matter of time. After trading in the most narrow range for the better part of the summer the VIX (see chart below) which is the ticker for the Chicago Board Options Exchange Volatility Index spiked this week over 60%!  This on fears that monetary policy changes are forthcoming here in the United States and abroad, especially as it pertains to interest rates. How is this a surprise though? There is not a day that goes by, in fact there is not an hour that goes by without headlines coming out pertaining to the Federal Reserve and what they will or will not do with interest rates.

Look my view is simple, count on it! Count on central banks changing their position on interest rates at some point in time. What amazes me is how much the markets and investors have become so reliant and seemingly make every investment decision based on whether interest rates remain near zero or begin to rise. How about this concept? Take a look at the premiums the markets have enjoyed over the past several years and minus that out. Then in my humble opinion we get back to fair value in stocks and markets. Although this has been one of the most profound bull markets in history, at some point in time equities are going to have to get off of the dependence on central bank accommodations. I look for ward to the day that we will be able to properly evaluate stocks and asset classes based on their respective fundamentals not on Federal Reserve policies.

Until then, the bulls can continue to enjoy the ride they have been on and I will continue to pay close attention to overbought and oversold conditions. With volatility back, this does create opportunity for the trader that is not too concerned with valuations. However, I expect that in the not so distant future, valuations will actually matter again. Good luck to all 🙂

~George

VIX chart George Mahfouz Jr

Volatility Back In Vogue…

Since the start of the year there has been a very noticeable uptick in volatility in the marketplace. Twice over the past couple of months volatility has spike past the coveted 30 value level which is considered to be the level that demonstrates a large amount of investor uncertainty and/or fear. This you can see clearly in the chart of the Chicago Board Options Exchange Volatility Index, Symbol: VIX (chart). The VIX tracks the S&P 500 and calculates the next 30-day expectation of implied market volatility of a wide range of call and put options related to the S&P 500. Investors have not seen this type of volatility in quite some time and traders and short sellers have certainly taken advantage of it.

Let’s take a look at what the increase in vol has done to the major averages. Year to date the Dow Jones Industrial Average (chart) is down over five percent, the Nasdaq (chart) is lower by almost nine percent, the S&P (chart) is off by over five percent and the small-cap Russell 2000 (chart) is down almost nine percent on the year as well. That said, these key indices have bounced sharply off of their recent lows in mid-Feburary and crude oil (chart) has seemingly found a interim bottom around the $30 dollar level.

So now what? I am expecting volatility to continue throughout the month of March especially as we lead up into the upcoming Federal Reserve policy meeting March 15-16th. Most experts do not expect the Fed to raise interest rates at this meeting and furthermore not until the economic data consistently proves otherwise.  In fact, there are certain economists out there that think that the Federal Reserve is handcuffed for now and won’t raise rates until the fourth quarter because of the global turmoil that has surfaced this year especially in China and Europe. The current global equity sell-off is without question part of the reason for the increase in vol here in the United States. Whatever the case is, I will be listening to what tone and language Janet Yellen will use at her press conference post meeting to get a sense of what’s next for rates and how this will effect our markets.

Good luck to all 🙂

~George

It’s All About Greece…

The Greece Crisis is at the forefront of the markets yet again. Greece closed its banks and stock market on Monday in an attempt to avoid on run on their financial institutions. The heightened state of Greece sent our markets into a tailspin on Monday, however the U.S. stock market did find it’s footing yesterday managing to eek out a small gain. For the month of June, the Dow Jones Industrial Average (chart) closed down 391.18 points at 17,691.51, the Nasdaq (chart) finished the month lower by 83.16 points at 4987.00, the S&P 500 (chart) -44.29 points at 2063.11 and the small-cap Russell 2000 (chart) was one of the only major averages that finished the month of June positive closing up 7.42 points on the month at 1253.95.

So what’s in store for the month of July you may ask? One word, Volatility! Since the realization that Greece is going to miss its $1.7 billion dollar debt payment it owes to the International Monetary Fund and that Greece may no longer be a part of the European Union, volatility slammed the global markets. The $VIX (chart) which trades on the Chicago Board Options Exchange is the Volatility Index. The $VIX indicates the market’s expectation of future volatility, 30 days to be exact, spiked as high as 41% since Monday. We have not seen this type of vol for months and I don’t expect it to let up anytime soon.

Although Greece continues to grab the headlines, there are other concerns that contagion can spread to other debt ridden EU countries such as Spain and Portugal. Even Puerto Rico has it’s own debt issues that are of increasing concern. I do expect that there will be a resolution of some sort to this latest crisis, but I also do believe volatility will stick around for a bit.

Another catalyst that could create additional volatility is the upcoming Q2 earnings reporting season. U.S. companies will begin to report their results after the 4th of July holiday and in earnest the week thereafter. So you can see why I believe volatility could be increasing over the next several weeks. As a trader, this is what you have been waiting on and if you are a long term investor, you have been through this before.

Both Paula and I wish everyone a very safe and Happy 4th of July Holiday 🙂

~George