Will Earnings Take The S&P To All Time Highs?

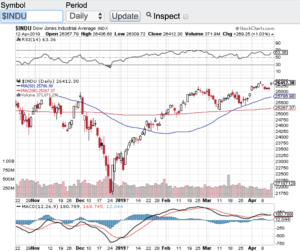
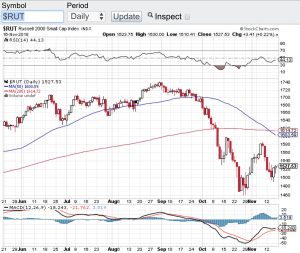
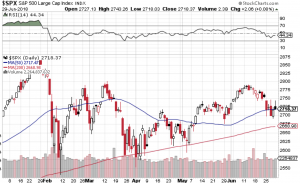
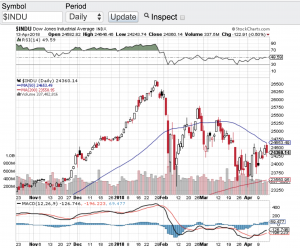
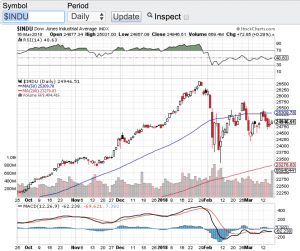
Now that earnings reporting season is upon us, will Q1 corporate earnings take the S&P 500 (see chart here) to all time highs? We are about to find out. For the first time in months the S&P 500 (see chart here) closed above the 2900 mark and is now within striking distance of its record close of 2940 set back in September. Once again the markets feel like they are in melt up mode. The Dow Jones Industrial Average (see chart below) closed on Friday at 26412 just 500 points away from its record high, the Nasdaq Composite (see chart here) is approaching the 8000 level a level it hasn’t seen in months, and last but not least the small-cap Russell 2000 (see chart here) is approaching the 1600 level and trading above its 200-day moving average.

The technical shape of the markets also appear to be healthy heading into Q1 earnings reporting season. All of the aforementioned indexes are trading above their 20-day, 100-day and 200-day moving averages. A good sign. Furthermore, none of these averages are in overbought territory this according the the relative strength index. Yet, another good sign.

Back to Q1 earnings reporting season. Although analysts and market pundits expect corporate earnings to have declined this quarter, I will be paying attention to the guidance that companies give. It’s no secret there has bee a global slowdown lately due to a variety of factors. However, if companies give better than expected guidance, then most likely we should indeed see new record highs.

Companies to look out for this week that are reporting are, Citigroup (NYSE: C), Goldman Sachs (NYSE: GS), Bank of America (NYSE: BAC), Johnson & Johnson (NYSE: JNJ), Netflix (NasdaqGS: NFLX), United Continental Holdings (NasdaqGS: UAL), Abbott Labs (NYSE: ABT), Alcoa (NYSE:AA), Las Vegas Sands, Corp. (NYSE: LVS), PepsiCo, Inc. (NasdaqGS: PEP), American Express (NYSE: AXP) and Honeywell International (NYSE: HON) just to name a few. Let’s see if Q1 earnings reporting season becomes the catalyst for new record highs. Good luck to all 🙂

~George

Dow Jones Industrial Average - Paula Mahfouz


8 In A Row!

8 in a row is the number of weeks that the Dow Jones Industrial Average (see chart below) and the Nasdaq Composite (see chart here) have notched gains. The S&P 500 (chart) and the small-cap Russell 2000 (chart) have also rallied sharply. So what’s going on? Earnings reporting season is well underway and so far it’s been somewhat of a mixed bag, although more bullish than bearish I would say. I think the obvious reason the rally is continuing is the fact the government did avoid another partial shut down this week and the chatter that has been coming out of China and the U.S. is that progress is being made towards an agreement on tariffs. That said, I am leery about an agreement coming together in the near future simply due to how both sides seemingly come together then fall back on whatever the tariff subject matter of the day. If there are any delays or signs of negotiations going sideways this could put a lid on the current rally and act as the catalyst for another pullback or correction. Some other chatter that has come up recently is corporate buybacks and how some politicians want to cap buybacks or outright regulate them. My friends if this happens, this too can be a catalyst for a pause and reversal of the 2019 market rally. Company buybacks have been a huge tailwind for this decade long bull market and if buybacks actually do become regulated, then things could look very different going forward especially in market sell-offs. We will see if this is just political chatter or something more.

Regardless of the pending outcome of the tariff negotiations or the balance of the Q4 earnings reporting season, I think we are due for a potential pullback of some sort after running for 8 straight weeks. The markets as a whole are a bit extended especially the small-cap Russell 2000 (chart)  which has entered overbought conditions with its RSI aka the Relative Strength Index (click here RSI) closing out the week at a value of 74.

Good luck to all 🙂

~George

Dow Jones Industrial Average - George Mahfouz Jr.


Tariffs and Interest Rates…

Tariffs and interest rates are at front and center. Now that Q3 earnings reporting season is winding down, without question the two remaining catalysts for these markets between now and year-end are  tariffs and interest rates. It’s been a long time since we have seen the swings that are going on right now in the stock market. Investor’s and trader’s alike are attached to every headline or tweet pertaining to the current trade war between China and the U.S. and whether or not the Federal Reserve will take its foot off of the pedal. The growing tensions between China and the U.S. regarding tariffs did abate late Friday when President Trump tweeted that China does want to make a deal. This was enough to rally the markets on Friday afternoon, but not enough to get the the key indexes out of the red on the week. On the week, the Dow Jones Industrial Average (chart) closed at 25,413, the S&P 500 (chart) closed at 2,736, the Nasdaq Composite (chart) closed at 7,248 and the small-cap Russell 2000 (see chart below) finished the week out at 1,527.

With the aforementioned looming catalysts on the horizon the big question is will we get a year end rally? My feelings are we may only need one of these catalysts to come through for a potential year-end rally. If China and the U.S. can agree upon more favorable terms to the imposed existing tariffs and/or actually withdraw some of the existing tariffs, we may have a shot. Not to say interest rates aren’t important, but relatively speaking interest rates still remain historically low. Even if the Federal Reserve raises rates in December, I still think that a China U.S. deal would be enough for a rally as we close out 2018. The G20 summit is just two weeks away and let’s hope some sort of deal can come forward out of the summit. Good luck to all 🙂

~George

Russell 2000 - Paula Mahfouz


Finally A Market Selloff!

In my last blog, I eluded to a market selloff that just did not happen and I was referring to how stocks typically behave in the August and September. Instead of markets selling off at the end of summer, stocks were setting records. Well the bears got what they had been anticipating over the summer and that is an eye-popping market drop last week. Over the course of two days the Dow Jones Industrial Average (chart) fell over 1300 points. Of course the S&P 500 (chart), the Nasdaq Composite (chart) and the small-cap Russell 2000 (chart) all fell in harmony as well. What’s more these bellwether indexes all breached their 200-day moving averages for the first time in months with the Dow Jones Industrial Average (chart) recapturing and closing above its 200-day on Friday, the Nasdaq Composite (chart) just closed shy of its 200-day, the S&P 500 (chart) literally closed right at its 200-day however, the small-cap Russell 2000 (chart) closed out last week meaningfully below its 200-day moving average looking to find some sort of support. The 200-day moving average is widely regarding by market technicians and institutional investors as a key metric of support and or resistance.

What does all this mean? First, a market that constantly goes up with no retracement to speak of can never be healthy long term. There must be backing and filling along the way so that the risk of a sudden and potentially drastic drop doesn’t occur as what we witnessed last week. I mean c’mon going up in the way that we have over the past decade is not only unheard of but the risk that can come forward from this can spark a nasty correction. I am not suggesting that this will be the case but for the first time since earlier in the year, investors and traders felt the selloff last week.

Earnings reporting season kicks in this week with hundreds of companies set to report. Let’s see if corporate earnings can buoy the market here during this long anticipated selloff. Good luck to all 🙂

George

A Market Selloff That Just Did Not Happen…

As summer ended where was the market selloff? Instead of conforming to what historically are the weaker months of the year whereas stocks at the very least should of paused with lighter volumes, the major averages hit all time highs. The Dow Jones Industrial Average (chart), the S&P 500 (chart), the Nasdaq Composite (chart), the small-cap Russell 2000 (chart) and even the Dow Jones Transportation Average (see chart below) all hit record highs in the third quarter. In fact the broad based S&P 500 (chart) turned in its best quarterly performance in five years. In my previous blog, I spoke to how traders and investors alike are awaiting a September selloff but seemingly nothing can stop this perma-bull market! Not trade wars, not interest rates, not the threat of inflation, not the daily chaos out of Washington, not historic seasonality, I mean nothing has stopped this bull market. Without a doubt this has been a close your eyes and a “go long” market. If you just did that over the past decade, you would of been part of 100% plus gains and whoever did do that, congratulations!

So now begs the question of what now? What now is fourth quarter earnings reporting season and oh yes the mid-term elections! October will not only be loaded with corporate earnings reports but there is also this little event call mid-term elections. I think it is safe to say that at the very least volatility should  rear its head up. As the summer trading months were unfolding vol went back to its “low vol” standard as we have witnessed for past decade. There is just no fear in the markets. The volatility index aka the VIX (chart) is a measure of investor fear and in this case, lack thereof. I have got to believe that volatility will increase as we head into earnings reporting season and especially as we approach mid-term elections. Good luck to all! 🙂

~George

Dow Jones Transports - George Mahfouz Jr

First Half Of 2018 In The Books…

The first half of 2018 is in the books and where in the world did that go? Year to date the Dow Jones Industrial Average (chart) is off about one percent, the S&P 500 (see chart below) is up a couple of percentage points but the Nasdaq Composite (chart) and the small-cap Russell 2000 (chart) are way outperforming the other benchmark indexes closing the first half of the year up almost 10% each.

Let’s take a look how the second half of the year is shaping up. We start off the second half of the year with of course the fourth of July holiday which this year happens to be in the middle of the week. I don’t expect too much market action this upcoming week especially with a shortened trading session on Tuesday followed by the markets closing on Wednesday in recognition of the 4th of July. There could be some positioning going on both Thursday and Friday after the holiday. but all in all I am expecting lighter volume throughout the week with not too much volatility. Now the following week and the second half of the year is a whole different story. Q2 earnings reporting season will begin in earnest the week of July 9th and this my friends will be the true beginning of the second half of the trading year. I expect volatility to kick in once again as corporate America unveils their most recent quarterly results. Furthermore, we will be getting ever closer to the midterm elections that promises to be filled with about as much drama and rhetoric one can imagine. Also, historically stocks have witnessed meaningful corrections at some point during the year leading up to the midterms and I do not expect this year to be any different. I also expect corporate America to report impressive growth to their top and bottom lines; however, these results may already be priced in.

Technically speaking the aforementioned indexes all remain above their respective moving averages with the Dow Jones Industrial Average (chart) hovering right around its 200-day. Paula and I wish everyone a very safe and Happy 4th of July 🙂

~George

S&P 500 - Paula Mahfouz


A Sell The News Environment?

We are almost at the midway point of earnings reporting season and it appears that we are in a “sell the news” type environment. Amazon (Symbol: AMZN), Intel (Symbol: INTC), Bank of America (Symbol: BAC) JP Morgan Chase (Symbol: JPM) are amongst other high profile companies that have smashed it out of the park with their latest quarterly earnings reports and yet the market does not seem to care. At best stocks have gone sideways with breakout moments only, only to find themselves priced back where they started before their earnings reports. One could say that stocks have already priced in their respective growth and the markets seem to agree. To close out the month of April, the Dow Jones Industrial Average (chart) closed at 24,163, the S&P 500 (chart) finished the month at 2648, the Nasdaq Composite (chart) closed at 7066 and the small-cap Russell 2000 (chart) settled at 1542.

As mentioned above, we are around the mid-point of the season and there are still hundreds of companies that are set to report their earnings this week which includes the likes of: Apple (NasdaqGS: AAPL), Devon Energy Corp. (NYSE: DVN), Gilead Sciences Corp. (NasdaqGS: GILD), Snap Inc (NYSE: SNAP), Avis Budget Group (NYSE: CAR), Caesars Entertainment Corp (NYSEL CZR), CVS Health Corp. (NYSE: CVS), Estee Lauder Companies Inc. (NYSE: EL), Holly Frontier Corp. (NYSE: HFC), Mastercard Inc. (NYSE: MA), MetLife Inc. (NYSE: MET), Yum! Brands Inc. (NYSE: YUM), Avon Product Inc. (NYSE: AVP), CBS Corp. (NYSE: CBS), Ferrari NV (NYSE: RACE), Kellogg Co. (NYSE: K), Shake Shack Inc. (NYSE: SHAK), Sprouts Farmers Market Inc. (NasdaqGS: SFM), Weight Watchers International Inc. (NYSE: WTW), Celgene Corp. (NasdaqGS: CELG) and Cheniere Energy Corp (NYSE: LNG). These are just a few of the names that report this week and as you can see there is a wide variety of companies that could potentially move the market from its most recent sideways action. Good luck to all 🙂

~George


Risks Abound!

As we enter into Q1 earnings reporting season there are risks abound! Whether it’s the brewing trade war with China, rising interest rates here at home or geopolitical tensions in the middle east, the risk profile of this market has certainly increased in recent weeks. Money center banks such as JP Morgan Chase (NYSE: JPM), Citigroup (NYSE: C) and Wells Fargo (NYSE: WFC) kicked off earnings reporting season and all reported solid earnings numbers only to see their stocks falter on Friday. So we could be setting up for a better than expected earnings reporting season and the markets won’t care due to the aformentioned risks that are present. We will certainly find out this upcoming week as hundreds of companies are set to report their quarterly results. We kick off the week with earnings from Bank of America (NYSE: BAC), Charles Schwab Corp (NYSE: SCHW), Netflix (NasdaqGS: NFLX) followed by Goldman Sachs (NYSE: GS), Johnson & Johnson (NYSE: JNJ), Intuitive Surgical (NasdaqGS: ISRG), United Continental Holdings (NYSE: UAL), United Healthgroup (NYSE: UNH), Abbot Labs (NYSE: ABT), American Express (NYSE: AXP), Morgan Stanley (NYSE: MS), United Rentals (NYSE: URI), Etrade Financial Corp. (NasdaqGS: ETFC), General Electric (NYSE: GE) Honeywell International (NYSE: HON), Procter & Gamble (NYSE: PG), Schlumberger (NYSE: SLB) and Transunion (NYSE: TRU) just to name a few.

Let’s take a gander at the technical shape of the markets. The Dow Jones Industrial Average (see chart below) has bounced off of its 200-day moving average multiple times over the past couple of weeks and is now hovering at its 20-day, the same can be said for the S&P 500 (chart), the Nasdaq Composite (chart) is right on its 20-day and 100-day moving averages as is the small-cap Russell 2000 (chart). So all of the key indices are at or slightly above key support levels and just maybe between earnings reporting season and key support levels in play, stocks can withstand the risks that are currently present. Good luck to all 🙂

~George

Dow Jones - George Mahfouz Jr


Red Week For Stocks, Technicals In Play…

Stocks had a tough week pressured by the prospects of rising interest rates and political turmoil out of Washington D.C. On the week, the Dow Jones Industrial Average (see chart below) closed lower by 1.5%, the S&P 500 (chart) closed the week down 1.2%, the Nasdaq Composite (chart) finished lower by 1% and the small-cap Russell 2000 (chart) ended the week down around 1% as well. Despite a choppy and red trading week, all of the aforementioned indexes are still up on the year.

As we celebrate St. Patrick’s Day we find ourselves in a period of no real short term catalysts to steer the market in either direction other than the FOMC meeting next week. I don’t expect the Federal Reserve to surprise the markets with a larger than expected interest rate hike or change their view on interest rate policy this year. The inflation data continues to remain tame although the labor market is heating up. So what is going to drive stocks between now and Q1 earnings reporting season in April?

When we find ourselves in a period such as the one we are in, I focus in on the technical shape of the markets. And as you can see in the charts of the major averages, all of them are at their moving averages support. Whether it’s the 9 day, 20 day, 50 day, 100 or 200 day moving average, stocks and indexes typically respect and is supported by moving average support lines with the 200 day moving average being the most reliable out of all of them. This doesn’t mean that this favorite technical indicator of most market technicians is infallible, but it sure has a history of being an effective tool when navigating the markets. All things considered, including the seasonality of the markets, I do expect that these support levels should hold at least until Q1 earnings reporting season. If the moving averages don’t hold, then I would not be surprised if we revisit the early February market correction lows. Good luck to all and Paula and I wish everyone a safe and Happy St. Patricks Day 🙂

~George

Dow Jones Industrial Average - Paula Mahfouz

An Earnings Bonanza!

Earnings reporting season is now in full swing and so far the numbers are not too shabby. A couple of earnings standouts so far are Netflix (NasdaqGS: NFLX) and Boeing (NYSE: BA). Netflix saw subscriber and revenue growth both exceed analyst’s expectations and their stock has skyrocketed since their earnings release last week. Boeing which reported before the bell yesterday also knocked the cover off the ball as the company nearly doubled its net income from the prior period a year ago. A company doubling its net income may not sound like a lot, but when you go from $1.63B in net income to $3.13B that is clearly moving the needle in a fascinating way. Boeing shareholders were also rewarded yesterday as the stock traded north of $350.00 per share hitting all-time highs. I am just highlighting a couple of standouts so far with hundreds of companies set to report over the coming days and throughout the next few weeks.

After a 2 day mini sell-off to start the week the key indexes did bounce back yesterday and resumed its  uptrend. The Dow Jones Industrial Average (chart) closed the month of January above 26,000, the S&P 500 (chart) closed out the month at 2823.81, the Nasdaq Composite (chart) closed at 7411.48 and the small-cap Russell 2000 (chart) closed at 1575. Even with the first noticeable sell-off earlier in the week the aforementioned indexes did have a stellar performance in January gaining more than 5% on the month.

I will say this, earlier in the week and for the first time in almost 2 years the market did feel vulnerable and the sell-off felt a bit different than recent pullbacks. Pundits are suggesting that interest rates may be playing a role in the volatility for the first time in years. I have been tracking the yield on the U.S. 10 year Treasury Note (Symbol: TNX) and for the first time in a long time the yield exceeded 2.7%. A break above 3% for an extended period of time could cause volatility to continue in stocks and may be the very first catalyst to put the brakes on this almost decade long bull run. Let’s see how the rest of earnings reporting season plays out and how interest rates fare in February before we can draw any type of conclusion. Good luck to all 🙂

~George