Are The Major Averages Breaking Out?

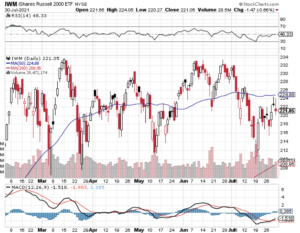
After breaching their respective 200-day support lines in March, the major averages appear to be breaking out of their months long trading range. The Dow Jones Industrial Average (see chart here), the S&P 500 (see chart here), the Nasdaq Composite (see chart here) and the small-cap Russell 2000 (see chart here) are all hitting monthly highs. Also, each of these indices appear to have strong momentum heading into July.

So why are the rally caps on? I think one of the drivers to this latest rally is how economy is faring. From the most recent GDP (gross domestic product report ) coming out stronger than expected to how inflation appears to be abating. Most every pundit expects our country to head into a recession, however, economic reports such as cited above are currently demonstrating a different backdrop. Market expectations have kept stocks in a trading range for the past several months until now.

The question now becomes is this a true “breakout” or is it a fake out? One catalyst that could answer this question is the upcoming Q2 earnings reporting season. Now that the second quarter of the year are in the books, corporate America will begin to report their Q2 earnings results here in July. This to me could prove whether or not this rally has more room to run.

When I look at the technical shape of the key indexes we are not yet in overbought territory according to the relative strength index aka the RSI. The only index that is near the 70-value level of the RSI is the S&P 500. According to the principles of the RSI, any index, stock, commodity etc. that trades above the 70 value of the RSI is considered overbought and we are not there yet. However, if this current rally continues then we could see the aforementioned indexes go into overbought territory. If this is the case, remember stocks and indexes can remain overbought for an extended period before reversion to the mean occurs.

Wishing everyone a safe and great 4th of July holiday weekend.

~George


Who’s Ready For The New Year?

After one of the weakest market performances since 2008, who is ready for the new year? I know I am!

Let’s take a look at how the major averages closed the year out. The Dow Jones Industrial Average (see chart here) finished lower by 8.78%, the S&P 500 (see chart here) shed almost 20%, the Nasdaq Composite (see chart here) fell a whopping 33% and the Russell 2000 (see chart here) closed the year down over 21%. Despite the bear market we now find ourselves in let’s not forget of how we got here. For the past 10 plus years and especially the past 3 years, central banks from around the world flooded the system with enormous liquidity. This liquidity came in many forms and with essentially charging little to no interest. The Federal Reserve Banks from around the globe started these programs when the 2008 financial crisis hit and for the better part of 15 years had not let up. What changed their position is how inflation took off this year to rates not seen in over 40 years.

Fast forward to today and we now have watched the Federal Reserve raise interest rates multiple times over the past several months and along with that taking the stock market with it. That said, I don’t blame the Fed for raising rates, in fact some pundits might argue as to why it took so long. Oh yea, a once in a century global pandemic shocked the world and the economy. So, what should have been a policy shift years ago became extended stimulus parade of liquidity into the system. Which by the way was very needed. Ok, so let’s not panic as to what occurred in the markets last year, from my vantage point this appears to be simply a function of interest rates and markets beginning to normalize.

Wishing everyone the healthiest, happiest, and most prosperous New Year 🙂

Cheers,

~George


The Fed Versus Inflation…

The market environment we find ourselves in is a clear dynamic of the Federal Reserve taking on inflation. The question now is will the Federal Reserve overreach with its interest rate war on inflation? One thing I have learned as it pertains to the markets is not to go against the power of the Fed and to trust they will ultimately steer the ship right.

That being said, what a month to forget for stocks! In the month of September alone the Dow Jones Industrial Average (see chart here) lost almost 9%, the S&P 500 (see chart here) fell over 9% while the Nasdaq Composite (see chart here) and the small-cap Russell 2000 (see chart here) both gave up over 10% in September. I think we are all ready to turn the page on the markets summer performance. In fact, the year to date performance of the major averages are well into bear market territory.

In hindsight it was plain as day how unsustainable asset prices were across the board. From the stock market to the real estate market to the crazy land of cryptos. The excesses that the markets enjoyed while they were hot was a direct reflection of the Fed’s easy monetary policies. From essentially zero percent interest rates, to buying up treasuries and other asset classes to keep the economy strong during Covid, now the markets are paying that price. The head scratcher for me is how long it took the Fed to reverse its course but at least now we can begin to get to normalized rates which is a net positive for all markets.

As I look at the current technical shape of the aforementioned indexes, it’s not a pretty sight. The Dow Jones Industrial Average (see chart here), the S&P 500 (see chart here) and the Nasdaq Composite (see chart here) are at or below their 52-week lows with no technical support yet in sight. The small-cap Russell 2000 (see chart here) is near its 52-week low but does have a bit of support right here. I think we could continue to see some more selling pressure before it’s all said and done but if you are a long-term holder of equities these type of market conditions can create some great opportunities too.

Good luck to all 🙂

~George

Technically Speaking…

The sell-off in the markets accelerated in the month of April and technically speaking it appears there could be more selling pressure ahead. On the year, the Dow Jones Industrial Average (see chart here) is down nearly 10 percent, the S&P 500 (see chart here) is off over 13%, the Nasdaq Composite (see chart here) is down over 21% and the small-cap Russell 2000 (see chart here ) year to date is down 17%.

I am not surprised of the market weakness due to all the factors at play right now. From the war in Ukraine, to the highest inflation rates we have seen in over 40 years, the ongoing Covid backdrop albeit this dynamic appears to be improving and finally, interest rates. The Federal Reserve now has woken up to the fact that this low interest rate environment that we have lived in for over a decade is over. Runaway inflation has now become a major concern for the Fed, and they are now being beyond vocal of their intentions. A 50-basis point increase appears to be the hike here in May and hikes throughout the year are in play. In my view, this is the top catalyst as to the sell-off but let’s keep things in perspective. Last year and previous years for that matter have been a boon for stocks and pretty much every other asset class out there. Record after record have been set for years on asset classes and this is simply not sustainable. A healthy correction is beyond needed and it seems like we are in that mode now!

Now let’s look at the technical shape of the aforementioned key indexes. The Dow Jones Industrial Average (see chart here), the S&P 500 (see chart here), the Nasdaq Composite (see chart here) and the Russell 2000 (see chart here) all closed the month of April out below their key moving averages. The 20-day, 50-day, 100 and 200-day have all been breached while the Relative Strength Index aka the RSI have not yet breached an “oversold” condition. The RSI is a technical “momentum indicator” that has two values of importance. The 70-value level for potential “overbought” conditions and the 30-value level and below is a level that is considered “oversold. All the above indexes are currently hovering around the 35 level. Please remember “technical indicators” are there as a guide and a tool when assessing the technical backdrop of any given stock or index and is not 100 percent perfect.

Good luck to all 🙂

~George


The 200-Day Recaptured!

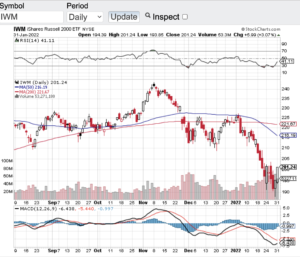
On the last trading day of January, both the Dow Jones Industrial Average (see chart here) and the S&P 500 (see chart here) recaptured and closed above their 200-day moving averages. Why is this important to note? The 200-day moving average of any index or stock for historically acts as significant support in an uptrend and in a downtrend can act resistance. Since the first half of the new year both of these indexes have sold off to the extent of breaching their 200-day moving averages. This can also be said for the Nasdaq Composite (see chart here) and the small-cap Russell 2000 (see chart here). What’s different right now amongst these key indexes is that the Nasdaq and Russell (see chart below) remain below their respective 200-day with some work to do. Let’s see if these two bellwethers can catch up to the Dow and S&P 500.

Headwinds do remain in the economy including inflation and now the backdrop of an upcoming rising interest rate environment. I think if the Federal Reserve manages their interest rate hikes in a methodical manner and communicates effectively to the street of their intentions, I don’t think the markets will be disrupted too much. Of course, geopolitical events such as the potential of Russia invading Ukraine and North Korea engaging once again in missile tests, these dynamics depending how they play out could impact the markets in the near term and the downtrend we witnessed last month could resume. Hopefully both geopolitical events turn out to be no more than a threat vs a reality.

Notwithstanding the above, I do see some hope with the pandemic numbers as of late. It does appear the spike in infections due to the omicron variant seem to have peaked which is great news for our country and the world for that matter. Hopefully soon there could be some semblance of normality which could be the catalyst for the recent downtrend in the markets to reverse its course as well.

Good luck to all 🙂

~George

The 200-Day Recaptured! - Paula Mahfouz


Nowhere Near Raising Rates…

In the words of Fed Chairman Jerome Powell “the Fed is nowhere near considering raising rates”! Last Wednesday the Federal Reserve held its FOMC meeting where it kept interest rates essentially at zero. This despite inflation seemingly everywhere along with a strengthening economy. So, what gives? Without question the most recent spike in Covid cases across our country continues to keep the Fed at bay pertaining to rates. I do get the thinking and strategy; however, I am a bit concerned of inflation overheating and the continuation of record setting asset prices.

Last week three of the four major averages hit all-time record highs. The Dow Jones Industrial Average (see chart here) hit an all-time high of 35171. On Thursday the S&P 500 (see chart here) notched a record high of 4429 and the Nasdaq Composite (see chart here) booked a record high of 14863. The small-cap Russell 2000 (see chart below) is the one index that is lagging a bit but the uptrend there remains intact.

As mentioned above, I am a bit concerned as to the non-stop record setting ways with asset prices. There seems to be a growing concern on the street about the potential ramifications of easy monetary policies that have been in place for over a decade and counting. There is no question interest rates need to go up and the money printing needs to abate. Yes, we are in a once in a century pandemic and there has been no choice other than to flood the markets with stimulus and support. However, this cannot go on forever.

That said, as I look at the technical shape of the aforementioned key indexes, there are currently no problems there. Three of the four indices that just set records last week all remain above their respective 20-day, 100 and 200-day moving averages. Also, these indexes are not yet overbought according to the relative strength index aka the RSI. So, folks it appears the record setting ways of our markets should continue in the near term. Make sure to always consult with a certified financial advisor(s) before making any decisions and/or adjustments to your investment strategies.

Good luck to all 🙂

~George

Nowhere Near Raising Rates - Paula Mahfouz

No June Swoon This Year…

No June swoon this year, these markets are simply not having it. June historically can be either a slow month or a month of selling pressure. Neither really happened this year. Despite a brief dip in the major averages a couple of weeks back due to inflation concerns, stocks and indexes held their own last month. The Dow Jones Industrial Average (see chart here) closed out the month at 34502, the S&P 500 (see chart here) finished the month just shy of 4400, the Nasdaq Composite (see chart here) closed out the month in record territory at 14503 and the small-cap Russell 2000 (see chart below) finished the month and first half of the year at 2310.

I remain in awe of the resiliency of stocks and most every other asset class out there. I read the other day that Facebook (NasdaqGS: FB) has become the fifth company in the United States to surpass the $1 trillion value mark. We now have in our country five companies that are valued at over $1 trillion dollars. Apple (NasdaqGS: AAPL), Amazon (NasdaqGS: AMZN), Microsoft (NasdaqGS: MSFT) and Alphabet aka Google (NasdaqGS: GOOGL) round out the top five trillion-dollar companies. When I see this type of action it makes me wonder how much earnings power do these companies need to continue to exhibit in order to keep their eye-popping valuations going? One other obvious similarity is the companies are all tech stocks and that is where the real growth has been. If you go back 20 years, I don’t think anyone would of expected five companies in our markets all reaching and boasting trillion dollar plus valuations. Heck, Microsoft’s market cap just surpassed $2 trillion dollars to join Apple as the only companies with more than a $2 trillion dollar valuation. Folks I am not a forensic analyst, but my goodness how is the law of large numbers playing a role here?

As I look at the technical shape of the major averages nothing really stands out to me with the exception of the Nasdaq Composite (see chart here). The Nasdaq has just entered overbought territory according to the relative strength index aka the RSI. The Nasdaq also just hit an all-time high so I think some sort of pullback could potentially be in the offing.

Have a safe and happy 4th of July weekend 🙂

~George

No June Swoon This Year - Paula Mahfouz


One Hot June!

One hot June indeed and I do not mean the weather folks! Stocks and commodities went on a tear in the month of June logging the best June in decades for some of the indexes and other asset classes. The Dow Jones Industrial Average (see chart here) soared over seven percent last month. The S&P 500 (see chart below) hit an all time high in the month of June while both the Nasdaq Composite (see chart here) and the small-cap Russell 2000 (see chart here) notched impressive gains as well. What’s more is both oil and gold surged right along side of the key indexes.

So why the rally? I think the answer is simply an easier monetary posture by the Federal Reserve. It is no secret that inflation is well in check and it is also becoming apparent that the U.S. job market is cooling off. Another factor for the Fed to consider is what impact would a full blown trade war with China do to the U.S. economy? This is why in my opinion we are seeing a continuing upward trend in our markets and that is a dovish Fed is usually very good for stocks. One other factor that will certainly weigh in is the upcoming earnings reporting season. Now that the second quarter of the year is in the books we will see how well corporate America did in Q2 as earnings reporting season gets underway this month. I will continue to look to monitor how “top-line” growth is faring.

Let’s take a quick look at the technical shape of the key indexes. After surging over 7% in June, the Dow Jones Industrial Average (see chart here) remains clearly above its 20-day, 100-day and 200-day moving averages as does the S&P 500 (see chart here). The Nasdaq Composite (see chart here) is in a healthy technical condition and last but not least, the small-cap Russell 2000 (see chart here) has broken above its key moving averages. This is a very good sign for stocks and furthermore none of indices are in overbought territory according to the principles of the RSI also known as the relative strength index.

Both Paula and I wish everyone a very safe and Happy 4th of July holiday 🙂

~George

S&P 500 - Paula Mahfouz


A Market Selloff That Just Did Not Happen…

As summer ended where was the market selloff? Instead of conforming to what historically are the weaker months of the year whereas stocks at the very least should of paused with lighter volumes, the major averages hit all time highs. The Dow Jones Industrial Average (chart), the S&P 500 (chart), the Nasdaq Composite (chart), the small-cap Russell 2000 (chart) and even the Dow Jones Transportation Average (see chart below) all hit record highs in the third quarter. In fact the broad based S&P 500 (chart) turned in its best quarterly performance in five years. In my previous blog, I spoke to how traders and investors alike are awaiting a September selloff but seemingly nothing can stop this perma-bull market! Not trade wars, not interest rates, not the threat of inflation, not the daily chaos out of Washington, not historic seasonality, I mean nothing has stopped this bull market. Without a doubt this has been a close your eyes and a “go long” market. If you just did that over the past decade, you would of been part of 100% plus gains and whoever did do that, congratulations!

So now begs the question of what now? What now is fourth quarter earnings reporting season and oh yes the mid-term elections! October will not only be loaded with corporate earnings reports but there is also this little event call mid-term elections. I think it is safe to say that at the very least volatility should  rear its head up. As the summer trading months were unfolding vol went back to its “low vol” standard as we have witnessed for past decade. There is just no fear in the markets. The volatility index aka the VIX (chart) is a measure of investor fear and in this case, lack thereof. I have got to believe that volatility will increase as we head into earnings reporting season and especially as we approach mid-term elections. Good luck to all! 🙂

~George

Dow Jones Transports - George Mahfouz Jr

Happy New Year!

Happy New Year to all and what a year of celebration for the bulls in 2016. The major averages last year notched very impressive gains. The Dow Jones Industrial Average (see chart below) finished the year up 2,337 points or 13.42%, the tech focused Nasdaq (click here for chart) closed up on the year 376 points or 7.5%, the S&P 500 (click here for chart) closed up 194 points or 9.54% and the small-cap Russell 2000 (see chart below) finished out 2016 up a whopping 221 points or almost a 20% gain outperforming most benchmarks. This eye-popping rally really kicked into high gear after the stunning upset victory Donald Trump pulled off over Hillary Clinton in the presidential election. So that was last year, now let’s take a look at 2017 and what lies ahead.

I begin with the obvious. Markets are certainly overbought and have been since the November 8th election results. Then in December, the Federal Reserve raised interest rates for the first time in a year and then added language for an additional rate hike in 2017 to bring the total projected rate hikes this year to at least three. Historically a rising interest rate environment puts pressure on equities and in particular the high beta names. Consensus has it that the Fed will move slowly to avoid any shocks to the economy or the markets. However, with Donald Trump’s proposed economic pro-growth policies, debt and inflation should rise. So I am sure the Federal Reserve will be keeping a close eye on how inflation ticks up as 2017 unfolds. Should inflation rise faster than anticipated this too could be a challenge for the Fed and our stock market.

So based on our current market environment it is my view that volatility will not only pick up in January but the recipe described above signals potential elevated volatility throughout the year. We also will begin to hear from corporate America this month as we head into earnings reporting season. I would expect earnings from multi-national companies to be a bit challenged due to the continuing and significant strength that the U.S. dollar has been exhibiting. That said, there will be opportunities abound in this new year but I am preparing to embrace volatility and hedge my positions going forward. In my next blog I will talk about hedging strategies in order to offset the impact of potential increased vol. Until then, both Paula and I wish everyone the happiest and healthiest new year to all. 🙂

~George

Dow Jones chart Paula MahfouzRussell 2000 post george mahfouz jr