Better Than Expected…

Q3 earnings reporting season has just begun and early on earnings are coming in better than expected. Almost 15% of the S&P 500 have reported their latest quarterly earnings and over 80% of that group have beat expectations. Included in this group that have already reported are Netflix (Nasdaq: NFLX), Bank of America (NYSE: BAC), JP Morgan Chase (NYSE: JPM), and Morgan Stanley (NYSE: MS) just to name a few. A look ahead to next week and hundreds of companies are set to report including but not limited to Halliburton (NYSE: HAL), TD Ameritrade (Nasdaq: AMTD), Biogen (Nasdaq:BIIB), Discover Financial Services (NYSE: DFS), Harley-Davidson (NYSE: HOG), McDonald’s Corp (NYSE: MCD), Proctor and Gamble (NYSE: PG), United Parcel Service (NYSE: UPS), Boeing Co (NYSE: BA), Caterpillar (NYSE: CAT). eBay (Nasdaq: EBAY), Ford Motor Co. (NYSE: F), Las Vegas Sands Corp (NYSE: LVS), Microsoft (Nasdaq:MSFT), O’Reilly Automotive (Nasdaq:ORLY), Paypal Holdings (Nasdaq:PYPL), Spirit Airlines (NYSE: SAVE), Tesla (Nasdaq: TSLA), Xilinx (Nasdaq: XLNX), 3M Co (NYSE: MMM), Aflac Inc (NYSE: AFL), American Airlines Group (Nasdaq: AAL), Capital One Financial Corp (NYSE: COF), Citrix Systems (Nasdaq: CTXS), Deckers Outdoor Corp (NYSE: DECK), First Solar (Nasdaq: FSLR), Gilead Sciences (Nasdaq: GILD), Southwest Airlines (NYSE: LUV), T-Mobile (Nasdaq: TMUS), Twitter (NYSE: TWTR), Visa Inc (NYSE: V), Goodyear Tire & Rubber (NYSE: GT), Phillips 66 (NYSE: PSX), and Royal Caribbean Cruises (NYSE: RCL). Hundreds more companies are set to report but you get the picture.

So with earning reporting season kicking into high gear, let’s see how investors continue to respond. On the week the Dow Jones Industrial Average (chart) closed at 26770, the S&P 500 (chart) closed just under the 3000 mark, the Nasdaq Composite (chart) closed at 8089 and the small-cap Russell 2000 (chart) closed the week at 1535. With the exception of today’s pullback the aforementioned indexes have all been in a recent uptrend. I think it is safe to say that next week’s earnings results will play a role in the markets direction.

Good luck to all 🙂

~George
Happy New Year!

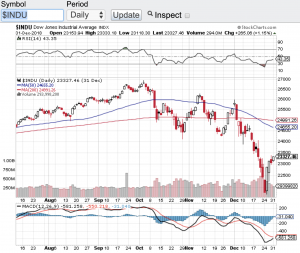
Happy New Year! Well if you have been long the markets and with the way stocks closed out 2018, it wasn’t so happy for the bull camp. However, a new year means new beginnings :-). Let’s do take a gander to see how the major averages fared in 2018. The Dow Jones Industrial Average ( click here or see chart below) finished the year down 5.6%, the S&P 500 (chart) closed the year down 6.2%, the Nasdaq Composite (chart) closed down 4% and the small-cap Russell 2000 (chart) closed 2018 down 12%. This is the worst performing year for stocks in a decade.

So what happened? In my view and simply put how can stocks go up in a straight line for over a decade without a correction? That’s right, stocks essentially have gone up for over 10 years’ without a healthy 20% correction. So when the markets finally had a real correction which is what occurred in the 4th quarter, it felt like the sky was falling. No question the Federal Reserve and rising interest rates have played a role in the market correction, however, let’s keep this in mind a 2-2.5% Fed funds rate is still historically low. What wasn’t normal over the past decade was a 0 percent interest rate policy and no market volatility. Everyone got spoiled with such an accommodative policy and market environment.

Another factor playing into the mix of the Q4 market correction is without question the trade war and tariffs that our President has ignited. This to me is even more of an issue to our economy than rising interest rates lifting to a normalized level. Not only is the trade war and its ramifications playing a role, but the inconsistency and chaos out of Washington are wreaking havoc on the markets.  No doubt in my mind that investors and Wall street are falling out of love with how our country is being governed, especially over Twitter. This is all fixable, we will just have to wait and see if the ego’s and the political agendas on both sides of the aisle can get the confidence back in our marketplace. Paula and I wish everyone the happiest and most prosperous 2019.  Good luck to all 🙂

~George

Dow Jones Industrial Average - George Mahfouz Jr

Late April Sell-Off Wakes Up The Bears…

Stocks sold off sharply on the last trading day of April. The Dow Jones Industrial Average (chart) fell 195 points, the Nasdaq (chart) closed down 82.22 points, the S&P 500 (chart) lost 21.34 points and the small-cap Russell 2000 (chart) finished lower by 26.83 points. The biotech sector has lead the charge in this most recent selloff with the most popular biotech ETF (Symbol: IBB) (chart) losing over 10 percent of its value since mid-March. Another factor in this sell-off is the sloppy earnings reporting season we find ourselves in. Just this week both Twitter (NYSE: TWTR) and Linkedin (NYSE: LNKD) surprised the street with their weak quarterly results and even weaker forward guidance. So the selling pressure is not just in the biotech space, it has now spilt over to the technology sector as a whole. That said, this morning there may be a bit of a respite with the futures market pointing up sharply.

Let’s take a look at the technical shape of the markets as we now enter into May. One troubling sign is the four major averages mentioned above have all breached their 50-day moving average line, with the small-cap Russell 2000 falling prominently below it. Let’s see if these key indices remain below this popular technical indicator for more than a few days. A one day breach does not necessarily mean a total technical breakdown however, another slight concern of mine is that these averages are not oversold yet according to the relative strength index or the RSI. Click here for the definition of the RSI. Now take a look at the charts of the Dow (chart), Nasdaq (chart), S&P 500 (chart) and the Russell 2000 (chart) and you will see at the very top of the chart the plot of the relative strength index and you will further see that these indexes have more room to go to reach the 30 value level of the RSI, which is the level that qualifies an oversold condition. Now throw into the mix that May is historically a weak month for equities and we indeed be in for some additional selling pressure.

In closing, I will re-visit the technical make-up of the markets in mid-May and see where there could be some buying opportunities. Good luck to all 🙂

~George