Solid Gains In Q1!

The major averages closed out the first quarter of the year posting solid results. The Dow Jones Industrial Average (chart) closed up 4.6%, the S&P 500 (chart) closed up 5.5%, the small-cap Russell 2000 (chart) gained 2.1% and the technology focused Nasdaq (chart) finished out the first quarter of the year up an eye-popping 10%. It’s no surprise how well tech did in Q1 considering how much this sector sold off after Trump won the election.

Although stocks continue to outperform, there has been some uncertainty coming into backdrop. The GOP’s inability to pass Trumpcare was the first sign of the potential breakdown of the new administration’s policies. Investors are beginning to wonder whether or not there will be more divide amongst republicans and how that could affect the upcoming tax reform bill. If there are any snags there or if that reform does not pass, some market pundits believe a 10-20% correction could occur.

Here are my thoughts about that. I do agree that if the proposed Trump tax reform does not go through, there indeed could be an immediate market reaction to the downside. How much, who knows? The markets are seemingly priced to perfection and then some. So if corporate tax rates are not reduced as Trump and his administration has outlined, why wouldn’t stocks be affected? Of course we will not know until late summer how the administration’s new tax policy will look like in its final state or whether or not it will even pass.

That said, there is plenty of runway between now and then for stocks and this starts with first quarter earnings reporting season. April is the month in which companies begin to report their earnings results to their shareholders. Corporate profits appear to be growing along with the economy. This my friends is where investors should be valuing stocks. So much emphasis has been put on the new administration’s economic and tax reform policies that we need not to forget about what really matters and that is corporate profits. That is not to say that government polices including the Federal Reserve don’t matter, but at the end of the day and when all the votes are in, growth and profits to me is what truly matters when valuing and investing in stocks.

Good luck to all 🙂

~George
 

Markets Cheer Fed Rate Hike!

As expected, the Federal Reserve raised short term interest rates by one quarter point and indicated that they will keep raising rates throughout the year albeit gradually. I do think what helped the markets yesterday was the language of only two more rate hikes this year. The economic data coming out so far is stronger than expected including the February jobs report which confirmed how the job market is continuing to expand and this had some pundits thinking three more rate hikes were in the cards for 2017, not just two. Markets rallied once again on the news and quite frankly the market is seemingly rallying on anything that hits the tape. That said, the Federal Reserve is doing a masterful job with how it is handling the change of guard so to speak from accommodation to raising rates and how they are communicating each message.

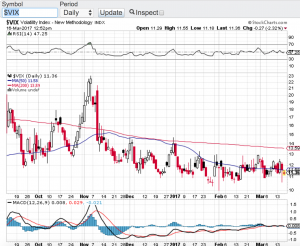
So what does this mean to the markets going forward? I gotta tell you as much as I have been expecting volatility to increase, my expectations now are as long as the Fed remains in its current position, volatility may just stay in hibernation until further notice. I have not seen a market to where vol has been and remains this low. As I write this blog the CBOE Market Volatility Index also know as the VIX remains historically low and even when there is pressure on stocks, the VIX does not move very much, just look at the chart below.

Taking a look at the four major indices, The Dow Jones Industrial Average (chart), the S&P 500 (chart), the Nasdaq (chart) and the small-cap Russell 2000 (chart) all are within striking distance of their record highs. The question now becomes will valuations be able to support the continuation of this bull market or will this be the catalyst to bring pause into this historic bull run. We won’t have to wait too much longer as the first quarter of 2017 winds down and companies prepare to report their earnings results beginning in April. Paula and I wish everyone a very safe and Happy St. Patrick’s Day 🙂

~George

VIX chart - Paula Mahfouz


Stocks Are In A Tailspin!

After starting the year off in sell mode, stocks are accelerating their declines and are now in correction territory. Yesterday’s rally sparked hope that a short term bottom was put in, however, this is not the case as the Dow Jones Industrial Average (chart) plunged 400 points at today’s open, the Nasdaq (chart) opened lower by over 100 points, the S&P 500 (chart) opened down over 2% and the small-cap Russell 2000 (chart) is now trading below 1000. What gives? First and foremost, China’s Shanghai Composite Index has lost over 20% of its value since late December and is now in a bear market. China’s market fall has indeed spilled over into the global markets. Secondly, crude oil (chart) has continued to decline and is now trading below $30 per bbl spreading fears of widespread bankruptcies in the oil and gas space. These two factors alone have been enough to send our markets into correction mode.

That said, what I try to do in this type of market environment is to place emotions in check and to keep things into perspective. Since this bull market began in 2009, we have not really experienced a market correction. Yes, it has been over six years since we have had a meaningful market decline that has stuck. People tend to forget that market corrections can be a very healthy thing for an overextended market. Investors and traders alike have been spoiled over the past six years by essentially taking their positions and switching on auto-pilot. I believe those days are gone and they should be. When the Federal Reserve took action and began their aggressive monetary policies i.e. buying bonds and placing interest rates at or near zero, stocks took off and did not look back. We have not been in a normalized market environment since then.

Fast forward to today and with essentially no Fed intervention and with a change in interest rate policy, we now have markets trading off of economic and corporate merits. This to me is not a bad thing because now investors can assess the value of the markets as well as individual stocks more accurately and more confidently. This is a concept that most traders and investors have been waiting on and that is to make their investment decisions based off of facts and not what the Federal Reserve will or will not do.

Good luck to all 🙂

~George

Once Again, All Eyes On The Fed…

Stocks closed lower last week for the first weekly decline of the broad indices in over a month. The Dow Jones Industrial Average (chart) closed the week down 1%, the Nasdaq (chart) -0.3%, the S&P 500 (chart) closed lower by 1.1% and the small-cap Russell 2000 (chart) also finished the week lower by almost 1%. I suppose a bit of a pullback was overdue considering how much the market has gained over the past five weeks or so. Some of the chatter is that this most recent weakness is due in part to the upcoming Fed policy meeting next week, and the expectation that the Fed is on the brink of changing its language pertaining to interest rates. Between strong economic growth and healthy corporate balance sheets, it’s no wonder analysts are expecting a shift in demeanor over at the Fed. Furthermore, oil has dropped significantly since late June which is finally beginning to show up at the pump. Lower gas prices is a positive for the consumer which could add more fuel to the economy, no pun intended. But wait a minute, the job market recently has done an about face with less hirings occurring in the month of August, which could give the Federal Reserve a reason not to put the brakes on so quickly. Personally, I think the Fed will become a bit more vocal   regarding rising rates over the coming months.

So what could this mean for stocks in the near term? For one, I expect more volatility between now and year end. Especially as it pertains to the upcoming third quarter earnings reporting season. We all know that the Fed will end its asset purchase program in October, and then next logical step for them is to begin to raise interest rates at some point in time. So corporate America sooner than later will have to stand on its own two feet and show top-line growth in order to appease investors and maintain their valuations. See, the accommodative policies over the past five years or so has in part given companies a pass so to speak if they weren’t growing their top-lines. What a lot of companies have done over the past few years is clean up their balance sheets by becoming more efficient by way of trimming expenses and implementing stock buyback programs. This of course in many instances improved their earnings and bottom lines, while not really growing their top-lines. Which is why I view the upcoming Q3 earnings reporting season as potentially one of the defining moments in this historic bull run we have enjoyed over the past five years. This could also be a “Goldilocks” moment where the Fed ends its asset purchase programs, begins to gently raise rates with minimal inflation in sight, and corporate America demonstrates top-line growth. This is what Janet Yellen and the Federal Reserve would call the perfect set-up. I, like most investors would love to see this theme play-out. However, let’s not forget the multi-trillion dollar balance sheet that the Fed has incurred during this unprecedented time of monetary accommodation, and as of now, no one really knows what type of impact this will ultimately have on our economy and our markets. Good luck to all and have a great week 🙂

~George


The Moment Of Truth May Be Upon Us…

We may be entering a period of where good economic news may be bad for stocks? U.S. gross domestic product bounced back sharply at a seasonally adjusted annual rate of 4% in Q2, according to the Commerce departments G.D.P. report issued on Wednesday. This was surprisingly higher than the consensus forecasts of 3% growth for the second quarter. Now wait a minute, isn’t economic expansion good for stocks? Well not if the markets have relied on ultra low interest rates and assets purchases by the Fed as the cushion and floor to the stock market. Stocks had one of their worst performances of the year yesterday and for the month of July the Dow Jones Industrial Average (chart) lost 1.56%, the tech heavy Nasdaq (chart) gave back 0.87%, the S&P 500 (chart) -1.5% and the small-cap Russell 2000 (chart) closed the month of July lower by an eye-popping 6.1%. Now the question becomes is this the beginning of a longer term trend in the marketplace or just another buying opportunity? Personally, I am a bit concerned over the set-up of the markets in general and it’s no secret a correction in equities has been long overdue. Add to the mix that historically and seasonally, August through October hasn’t been a favorable time for stocks. So I think erring on the side of caution may be the wise thing to do.

Let’s take a look at the technical set-up of the aforementioned key indexes. The first thing I want to look at is whether or not the markets are overbought or oversold according to the RSI principle. The relative strength index a.k.a. the RSI, is a technical indicator that compares the size of moves of both recent gains and losses to determine overbought and oversold conditions. The 70 value level and higher and the 30 value and lower are considered extreme conditions. As of the close of trading yesterday, the Dow Jones Industrial Average (chart) RSI was at 32.09, the Nasdaq (chart) RSI was at the 44.24 value level, the S&P 500 (chart) RSI was at 35.85 and the small-cap Russell 2000 (chart) RSI was at 34.76. So as you can see these key indices are not yet in extreme oversold conditions. From a technical standpoint, my preference is to enter positions only when extreme conditions occur, that is when RSI levels are below 30 or above 70. Of course this position has to be supported by strong fundamentals as well. When you have both factors going for you, chances are the set-up would most likely provide favorable results.

Now another favorite technical indicator of mine are the moving averages. The 20-day, the 50-day and the 200-day are the most popular moving averages certain market technicians utilize. The moving average lines historically provide support and/or resistance depending on which side of the line the asset resides. As of the close of yesterday, the Dow Jones Industrial Average (chart) fell below its 50-day moving average for first time since mid-May, the Nasdaq (chart) fell below its 20-day, however, its still trading above its 50-day and may find some support there? Looking at the S&P 500 (chart), it too has fallen below its 50-day moving average and the small-cap Russell 2000 (chart) has now taken out its 200-day moving average and is technically the weakest index of the group.

So as you can see, the markets are not yet in extreme oversold conditions according the the RSI principle and the moving averages are currently being violated, which may indicate that the selling pressure may not be over. Of course this is only a technical recap of current market conditions which is only one component that can shape the markets. Please remember that it is best to always consider consulting with a certified financial planner(s) before making any adjustments to your portfolio or developing any investment or trading strategies .

Best of luck to all 🙂

~George