The 200-Day Recaptured!

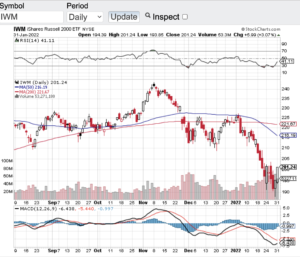
On the last trading day of January, both the Dow Jones Industrial Average (see chart here) and the S&P 500 (see chart here) recaptured and closed above their 200-day moving averages. Why is this important to note? The 200-day moving average of any index or stock for historically acts as significant support in an uptrend and in a downtrend can act resistance. Since the first half of the new year both of these indexes have sold off to the extent of breaching their 200-day moving averages. This can also be said for the Nasdaq Composite (see chart here) and the small-cap Russell 2000 (see chart here). What’s different right now amongst these key indexes is that the Nasdaq and Russell (see chart below) remain below their respective 200-day with some work to do. Let’s see if these two bellwethers can catch up to the Dow and S&P 500.

Headwinds do remain in the economy including inflation and now the backdrop of an upcoming rising interest rate environment. I think if the Federal Reserve manages their interest rate hikes in a methodical manner and communicates effectively to the street of their intentions, I don’t think the markets will be disrupted too much. Of course, geopolitical events such as the potential of Russia invading Ukraine and North Korea engaging once again in missile tests, these dynamics depending how they play out could impact the markets in the near term and the downtrend we witnessed last month could resume. Hopefully both geopolitical events turn out to be no more than a threat vs a reality.

Notwithstanding the above, I do see some hope with the pandemic numbers as of late. It does appear the spike in infections due to the omicron variant seem to have peaked which is great news for our country and the world for that matter. Hopefully soon there could be some semblance of normality which could be the catalyst for the recent downtrend in the markets to reverse its course as well.

Good luck to all 🙂

~George
The 200-Day Recaptured! - Paula Mahfouz


Happy New Year And New Decade!

Happy New Year and New Decade! However, I am not so sure investors want to say goodbye to 2019. What a year for stocks and the major averages. In 2019 the Dow Jones Industrial Average (see chart here) gained 22%, the S&P 500 (see chart here) soared almost 30% on the year, the Nasdaq Composite (see chart here) was the best performing major average up 35% and the small-cap Russell 2000 (see chart here) closed 2019 up almost 24%. This is the best annual performance for these key indexes in years. As far as the decade goes, the major averages also soared gaining almost 300%. Not a typo folks the markets almost tripled in value over the past decade.

So as we enter the new year the question now becomes what now? Well it is hard to imagine that we will see a similar result in 2020. Not that I am bearish at all but I do expect some higher than normal volatility throughout 2020. Geopolitic tensions have started to ramp up a bit and in Washington the focus and attention will be on the Senate impeachment trial. As much as the Republicans control the Senate, there is no guarantee that bombshells won’t come out of the trial. This especially rings true if the House Democrats gets witnesses to the stand. We cannot predict what may come out of this trial and I got to believe at times it won’t be pretty. Also, the month of January can be volatile just from the standpoint of how much the markets gained in 2019. I am pretty confident that we will see some institutional and other managed funds book gains here in January.

One other consideration is how the markets as a whole became overbought as 2019 came to an end. All of the aforementioned indexes went into overbought conditions in December according to the relative strength index (RSI). Although there was a brief retreat from the overbought 80 value levels of the RSI, we still remain near the upper end of the charts and I would not be surprised to see some selling pressure here in the month of January.

Good luck to all 🙂

~George

Despite A Month End Rally, Stocks Took It On The Chin!

January proved to be one of the toughest months for stocks in years. The Dow Jones Industrial Average (chart) closed the month down 5.5%, the Nasdaq (chart) closed down 8%, the S&P 500 (chart) fell 5.1% and the small-cap Russell 2000 (chart) finished the month out down almost 9%. If it wasn’t for the strong month end rally, both the Nasdaq (chart) and the small-cap Russell 2000 (chart) would of closed out in correction territory. Clearly China and Oil continue to grab the headlines and continue to make investors very nervous. However, on Friday the Bank of Japan in a surprise move implemented negative interest rates for the first time ever in an attempt to aggressively stimulate their struggling economy. So once again a central bank acts and the markets respond. Even our own Federal Reserve stated last Wednesday that they are on high alert pertaining to the global markets and the affects that are being felt here at home. In other words, there may be a pause in raising interest rates here in the U.S.?

That said, what never ceases to amaze me is how technically disciplined the markets can be. If you look at the major averages over the past two weeks you will see that all of these key indices held their August 2015 lows. Especially the Dow (chart) and the Nasdaq (chart) which traded down almost to the nickel to their respective August lows. In my previous blog I cited the Federal Reserve and their policy shift to raising interest rates and the fact that now markets and equities can be assessed on their own merits versus what the central banks may or may not do. Well Friday’s Bank of Japan’s move is a reminder that central banks around the world are ready and capable of intervening at any point in time. Which brings me back to this, how in the world can you confidently have a short thesis in these markets? In my opinion, this model is simply too risky when you have monetary policies that can turn on a dime.

So what’s an investor or trader to do? One thing that stands out to me is throughout all of the noise and chatter is that the technicals continue to perform with the utmost efficiency. Whether markets or equities are overbought or oversold vis-Ă -vis the relative strength index (RSI) , or support lines are met and hold. No one can deny how disciplined and efficient technical analysis can be.

Good luck to all 🙂

~George

A Mixed Bag…

At the height of Q4 earnings reporting season, results from corporate America have been conflicted, so far. Let’s start with everyone’s favorite, Apple (NasdaqGM: AAPL). Despite sales of its iPhone hitting records during the holiday season, those sales were shy of what the street was expecting by three million units. Furthermore, during the conference call after its earnings release on Monday, management projected a softer outlook for the upcoming quarter amid growing competition in the smartphone and tablet marketplace. This was enough to send Apple’s shares lower by over 10% this past week. In fact, the majority of the retailers have reported very disappointing results this earnings reporting season with the widely followed and traded retail SPDR S&P Retail ETF (NYSE Arca: XRT) (chart) down almost 10% for the month of January.

Now let’s take a look at the results of the four key indices so far this year. For the month of January, the Dow Jones Industrial Average (chart) is down 5.3%, the tech-heavy Nasdaq (chart) is off by 1.7%, the S&P 500 (chart) is lower by 3.6% and the small-cap Russell 2000 (chart) finished the month down by 2.8%. In my January 1st blog, I eluded to expecting a 5%, 10% or even a 15% correction in 2014, and we could very well be in this corrective phase as we speak. The question now to investors and traders alike is how steep could this current pullback become? Let’s not forget we are coming off of a year in which these key indexes individually gained well over 25%, with the Nasdaq leading the way gaining a whopping 38% in 2013. What I try to do is tune out all of the noise that comes out of the financial cable channels and media and focus on seasonal patterns and the technicals of the market. Technically speaking, the markets are not yet in an extreme oversold condition according to the RSI principles. Remember the Relative Strength Index a.k.a. the RSI is one of my favorite technical indicators where overbought and oversold conditions are exhibited depending on certain value levels. In this case and according to the RSI principle, the 30 value level and below is considered oversold and anything below 20 is considered extremely oversold. We are just not there yet. However, one thing I do want to highlight is for the first time in months the aforementioned key indices have all fallen and closed below their 50-day moving averages. Something that has not occurred since early October of last year and something we want to keep an eye on. If the markets cannot rise back and remain above their 50-day in the near future, the 200-day support line could be the next real support for these markets. I am not suggesting that we will test the 200-day moving average, but if this is the case, the selling pressure would most likely continue and may actually increase. Let’s see how next week’s earnings reports come in before we draw any further conclusions.

Looking ahead to next week, we will here earnings results from petroleum producer Anadarko (NYSE: APC), real estate investment trust Annaly Capital Management (NYSE: NLY), Yum Brands (NYSE: YUM), Boston Scientific Corp  (NYSE: BSX), retailer Michael Kors (NYSE: KORS), Cognizant Technology Solutions Corp (NasdaqGS: CTSH), Green Mountain Coffee Roasters (NasdaqGS: GMCR), Pandora Media (NYSE: P), AOL Inc. (NYSE: AOL), Expedia (NasdaqGS: EXPE), General Motors (NYSE: GM), Verisign Inc. (NasdaqGS: VRSN), Apollo Global Management (NYSE: APO), Flir Systems (NasdaqGS: FLIR) and Moody’s Corp (NYSE: MCO) just to name a few. So as earnings reporting season continues, so do the markets. Good luck to all.

Have a great weekend 🙂

~George