Volatility Hits The Markets…

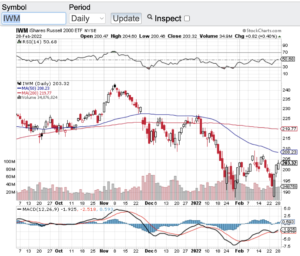
Volatility has hit the markets to the point that the VIX (see chart here) aka the fear gage has broken out. Stocks have been on a tear as of late but unfortunately to the downside. No one is surprised that the markets have become extremely volatile due to the Russian invasion of Ukraine. The Dow Jones Industrial Average (see chart here) fell over 10% since the crisis began as has the S&P 500 (see chart here). Both the Nasdaq Composite (see chart here) and the small-cap Russell 2000 (see chart here and below) have sold off closer to 15% before bouncing off of their sell-off lows. Again, no surprise that vol has spiked to almost a double over the past few weeks as tensions increased.

Before we get into the technical shape of the markets it’s hard for me to even talk stocks and indexes due to the atrocities happening abroad. Our prayers go out to everyone in the Ukraine that is being affected by this invasion and for the people of Russia who wants no part of this. Hopefully very soon a cease fire will happen and happen for good!

Now let’s look at the technical set-up that has occurred since the buildup and invasion with the aforementioned key indexes. Starting with the Dow Jones Industrial Average (see chart here). The Dow a few days ago hit a low of 32272 and has bounced to the 34,000 zone. There is much more work here to be done before the Dow can recapture its 100 and 200-day moving averages. The same can be said for the S&P 500 (see chart here) although with the S&P, it is closer to its 20-day M/A than the Dow Jones Industrials Average. Interestingly both the Nasdaq Composite (see chart here) and the small-cap Russell 2000 (see chart here) have bounced off of their recent lows stronger with the Russell 2000 recapturing its 20-day M/A. Despite the recent bounces off of their sell-off lows I think it is fair to say that we are not out of the woods yet in the volatility we have seen as of late. If you are a long-term investor, this will pass at some point in time. For experienced traders this is an environment where money can be made both on the long and short side of the markets. That said, I always recommend consulting your certified professional financial advisor(s) before making any moves in the backdrop we currently find ourselves.

Good luck to all 🙂

~George
Volatility Hits The Markets - Paula Mahfouz

New Variant Spooks Markets…

A new Covid variant has spooked the markets enough to spike the VIX almost 50% (see chart here). The VIX aka the fear index took off on Friday after news out of South Africa that a new variant has emerged. The CBOE volatility index is a measure of price action in the S&P 500 options chain over the next 30 days. Investors and institutional investors alike pay attention to how investor sentiment is going at any point in time through the CBOE vol index. Historically when the markets are at work with no real headwinds or threats, the VIX in the 10-15 value range. Yesterday the VIX closed north of 27. No question over the past few days the VIX is revealing a bit of investor anxiety.

So now the question becomes is this a short-lived dynamic or is there more selling pressure in the offing? My feelings are this is a normal knee jerk reaction to yet another potential obstacle our economy and markets face. From what I have read we are weeks away to understanding the severity of this new variant or lack thereof. In the meantime, I think patience is key and to not act in haste. For all we know the vaccines could protect the population from this latest variant and if so, the markets could snap right back. However, if this becomes as severe and contagious as the Delta variant, then there is a strong chance the markets would continue to adjust accordingly.

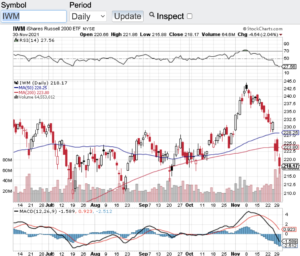
Let’s look at the technical backdrop of the major averages starting with the Dow Jones Industrial Average (see chart here). The Dow sold off over 650 points yesterday to close just above its 200-day moving average. The S&P 500 (see chart here) closed lower by 88 points approaching its 100-day moving average. The Nasdaq Composite (see chart here) closed the month of November down 245 points while breaching its 20-day moving average. Last but not least, the small-cap Russell 2000 (see chart below) closed down sharply as well yesterday, however, technically the Russell broke its 100 and 200-day moving averages in a meaningful way which does not bode well for this particular index as we enter the last month of the year.

One final note, no matter what happens in the market here in the short term, please take care of yourselves and your loved ones. We are approaching the two-year mark of this pandemic and everyone should take this serious, put the politics and conspiracy theories away and come together once and for all.

Wishing everyone a safe and healthy holiday season 🙂

~George

New Variant Spooks Markets - Paula Mahfouz

Finally A Tradable Market!

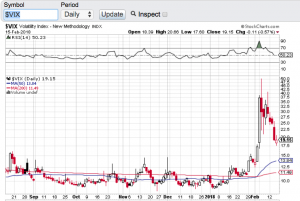
After years of essentially low to no volatility, traders finally get what they have been wishing for and that is a tradable market! In 2017 the markets witnessed the longest stretch of low vol in recent memory. In fact the VIX (see chart below) which is the ticker symbol for the Chicago Board Options Exchange volatility index traded in the 10 zone for most of 2017. The 10 level on the VIX (chart) is beyond abnormally low especially lasting for the better part of a year. Fast forward to today and the VIX is hovering around 20 after spiking to over 50 over the past two weeks. We haven’t seen the VIX (chart) at the 50 level in years. Call it long overdue, call it the market needed to correct, call it higher interest rates, call it what you want but finally we seemingly have more of a normal market environment. Not to say it wasn’t gut wrenching watching 1000 point Dow Jones Industrial Average (chart) intra-day swings over the past couple of weeks compared to the slow melt-up investors have enjoyed for years. Traders on the other hand have underperformed the markets during the melt-up because there simply was not enough or no volatility to be able to trade.

Stocks have indeed bounced sharply from the early February market correction. The Dow Jones Industrial Average (chart) closed the day up 307 points, the tech focused Nasdaq Composite (chart) closed up on the day 113 points, the S&P 500 (chart) closed up 32.5 points and the small-cap Russell 2000 (chart) finished the trading session up 15 points. Going forward I am certainly going to respect the technical make up of the aforementioned indexes and select stocks. Moving averages such as the 20-day, 50-day and 200-day tend to provide reliable support and resistance marks and now that we are out of the no vol environment, these moving averages tend to be more accurate and can be used to determined entries and exits in positions you hold and or trade. As I write this blog the key indexes have now rebounded to their 50-day moving averages so we will see if this technical indicator will act as resistance or if the markets can hold, breakthrough and proceed higher. Of course there is much more to consider when entering or exiting any position or strategy but when volatility comes back into the markets, most professional traders key in on the moving averages. Good luck to all 🙂

~George

VIX - Paula Mahfouz

Volatility Back In Vogue…

Since the start of the year there has been a very noticeable uptick in volatility in the marketplace. Twice over the past couple of months volatility has spike past the coveted 30 value level which is considered to be the level that demonstrates a large amount of investor uncertainty and/or fear. This you can see clearly in the chart of the Chicago Board Options Exchange Volatility Index, Symbol: VIX (chart). The VIX tracks the S&P 500 and calculates the next 30-day expectation of implied market volatility of a wide range of call and put options related to the S&P 500. Investors have not seen this type of volatility in quite some time and traders and short sellers have certainly taken advantage of it.

Let’s take a look at what the increase in vol has done to the major averages. Year to date the Dow Jones Industrial Average (chart) is down over five percent, the Nasdaq (chart) is lower by almost nine percent, the S&P (chart) is off by over five percent and the small-cap Russell 2000 (chart) is down almost nine percent on the year as well. That said, these key indices have bounced sharply off of their recent lows in mid-Feburary and crude oil (chart) has seemingly found a interim bottom around the $30 dollar level.

So now what? I am expecting volatility to continue throughout the month of March especially as we lead up into the upcoming Federal Reserve policy meeting March 15-16th. Most experts do not expect the Fed to raise interest rates at this meeting and furthermore not until the economic data consistently proves otherwise.  In fact, there are certain economists out there that think that the Federal Reserve is handcuffed for now and won’t raise rates until the fourth quarter because of the global turmoil that has surfaced this year especially in China and Europe. The current global equity sell-off is without question part of the reason for the increase in vol here in the United States. Whatever the case is, I will be listening to what tone and language Janet Yellen will use at her press conference post meeting to get a sense of what’s next for rates and how this will effect our markets.

Good luck to all 🙂

~George

Volatility Is Back, Q3 Earnings Reporting Season On Deck…

After being in hibernation for most of the year, volatility is back at the forefront of the markets. The Volatility Index Symbol: VIX (chart) has spiked about 50% over the past couple of weeks which is a clear indication that investors are starting to get a bit nervous and fearful of the markets. The VIX demonstrates the next 30-day expectation of market volatility by calculating the implied volatilities of both puts and calls options of S&P 500 companies. Even the Dow Jones Industrial Average (chart) have experienced intraday triple digit swings over the past several trading days, something we have not seen in a long time. I think it is safe to say that the increase in vol is due in part to the markets continuing to post record highs, the fact that the federal reserve will be ending its asset purchase program this month and seemingly everyday now headlines of geopolitical uncertainty are abound . Furthermore, with the third quarter of the year now in the books, earnings reporting season is upon us. I don’t think it’s a coincidence that volatility has increased with all of the aforementioned factors in play. In fact, this particular earnings reporting season will  most likely be put under the microscope like no other recent quarter. Stocks have enjoyed the the accommodative policies of the Fed for the past several years and now one of the key components of the stimulus program will end here in October. As I mentioned in my previous blog, it will be up to corporate America to stand on its own two feet and begin to demonstrate top-line growth as they grow their earnings. Over the past couple of years many corporations have grown their bottom line by way of becoming more efficient, reducing their workforce and implementing stock buyback programs. I believe going forward financial engineering and in-house efficiencies won’t be enough to satisfy investors appetites.

As the third quarter ends and technically speaking, the Dow Jones Industrial Average (chart), the Nasdaq (chart), and the S&P 500 (chart) appear to be finding some support at their respective 50-day moving averages, however, the small-cap Russell 2000 (chart) continues to lag the big-caps and trade well below its 50-day and 200-day moving average. That said, what is impressive to me is even though volatility has picked up steam, most every pullback is met with support from willing buyers and sell-offs appear to be short lived. The concern I have is whether or not this pattern of support continues. As mentioned, Q3 earnings reporting season is on deck and I do not believe companies will be given free passes anymore to modest top-line growth. If you are a trader, this is type of environment that you have been waiting for. However, if you are an investor with a longer term view, then it is time to look at the intrinsic value of your holdings to reduce the impact of a higher vol environment. Also, options premiums tend to increase along with higher volatility which could bode well for option sellers. Whatever the case is, as we enter the last quarter of the year, I expect volatiily to continue and at points increase, which could create some panic selling and create great opportunities with the right companies. I am looking forward to this upcoming earnings reporting season and will look for oversold conditions to act.

Have a great October 🙂

~George


Overbought Conditions and Iraq Weigh In On Stocks…

After the Dow Jones Industrial Average (chart) and the S&P 500 (chart) set all time highs last Monday, the conflict in Iraq and overbought conditions spun a modest pullback in the key indices. Although some are attributing the selling pressure to the unexpected defeat of the House majority leader Eric Cantor (R., VA).  For the week, the Dow Jones Industrial Average (chart) lost 148.54 points, the tech ladened Nasdaq (chart) -10.75 points, the S&P 500 (chart) -13.28 points and the small-cap Russell 2000 (chart) closed slightly lower on the week. What has been eye popping to me is how complacent and tranquill market participants have been. Over the past several months and especially the past couple weeks, investor sentiment has been extremely bullish which in turn has sent the VIX to multi-year lows. The VIX, also know as the fear gauge, is used as an indicator of investor sentiment. Recently the value of the VIX (chart) hit a trough low of 10.73, its lowest level since 2006. Out of all of the market events that are going on, this indicator has me concerned more than any other. As much as I have been bullish on the overall markets, when sentiment gets this comfortable and the VIX trades this low, historically markets set up for a pullback or even a correction of sorts.

This set-up is just what both the bears and the bulls have been waiting on. I personally have been tempted to short this market considering the historic record breaking run up stocks have had. But I have learned a long time ago is you don’t want to step in front of the Federal Reserve or a freight train either, which is what this market has been. So my preference is to be patient, wait for whatever pullback(s) or correction we may get, and then begin to scale in on certain long positions. I will refer to the technical set-ups of indexes and certain equities to assist me in establishing entry points. Click here to see what I look at pertaining to technical analysis. Now whether you are a technical trader or fundamental investor, the fact remains that markets remain awash with liquidity thanks to the Fed, and there really is no where else to get the alpha that hedge funds and institutional investor alike need for their performance mandates. So knowing that these institutions really dictate the ebbs and flows of the markets, my bets will continue to align with theirs and over the past few years whenever we do experience an increase in market volatility and market pullbacks, a buy signal usually ensues. Please remember it is always wise to at least consult with a certified and trusted financial advisor(s) before you compose any investment strategy or make any investment decisions. Good luck to all.

Happy Father’s Day 🙂

~George

Is risk back off?

On the last trading day of May, the Dow Jones Industrial Average (chart) sold off by 208.96 points, the Nasdaq (chart) -35.38, the S&P 500 (chart) -23.67 and the small-cap Russell 2000 (chart) finished the day lower by 10.28 points. Is this a possible prelude for the month of June? After the six-month+ run that stocks have been on, one has to wonder if these markets are poised to correct?

As I wrote in mid-May, I expected volatility to begin to increase, and sure enough the VIX (chart) also known as the fear gauge spiked 27.5% over the past two weeks. Ever since the Fed began mapping out an exit strategy, the market chatter has steadily increased as to how stocks and bonds would react. Furthermore, since its May policy meeting, the Fed has had a difficult time communicating its position as to how it will move forward. I know that some type of jaw boning needs to occur in order to prepare the markets for the beginning of monetary easing. However, a policy statement at the beginning of May indicated that the Fed’s next move could either be up or down? Confusing isn’t it? So it’s no wonder some sort of fear has begun to creep into these markets.

That said, this has become such an unprecedented market environment, I don’t know what to think right now. Isn’t the job market, corporate earnings, and top-line growth supposed to drive stocks? What I and many on the street are concerned with is the day the Fed decides to begin its wind down, how will equities react? Next week I will be paying close attention to the plethora of economic reports that will be issued which includes the PMI and ISM manufacturing indexes, the Beige Book and of course the all important Jobs report which will be issued on Friday before the market open, just to name a few. If the economy can begin to demonstrate meaningful strength, then any type of pullback or correction will most likely be met with wide support. However, if economic numbers stay weak, then we could very well be in for a lot more volatility this summer. Good luck to all.

Have a great weekend 🙂

~George

5% haircut since election day…

One can surmise that the markets have most certainly voted! Once again stocks sold off this week in light of the fiscal cliff fears and whether or not Washington will be able to get a deal done. For the week, the Dow Jones Industrial Average (chart) fell 1.77%, the Nasdaq (chart) -1.78%, the S&P 500 (chart) -1.45% and the small-cap Russell 2000 (chart) closed lower by 2.36%. There was a bit of reprieve from the selling pressure yesterday after both sides of the aisle came out of their first formal fiscal cliff meeting and indicated progress was being made. This was enough to help the aforementioned indexes to close in the green on Friday.

The market climate that we are now in reminds me of last summer when Congress was battling it out over the debt ceiling crisis and how the key indices were down close to 10% in a short period of time. Back then market volatility was historic while the politicians were duking out that crisis. Although stocks are certainly in correction mode, what I am not seeing this time is enormous volatility. Let’s take a look at the VIX index (chart). The VIX, also known as the fear gauge, is used as an indicator of investor sentiment. Right now the value of the VIX (chart) is not indicative of extreme panic in the marketplace especially when you compare it to last summer. Hopefully Washington can come up with a solution to resolve the fast approaching cliff which would restore confidence and calm the markets. Good luck to all.

Have a great weekend 🙂

~George