Volatility Hits The Markets…

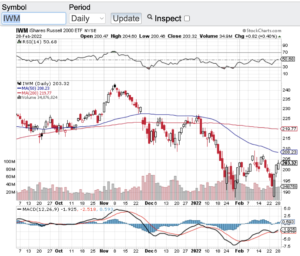
Volatility has hit the markets to the point that the VIX (see chart here) aka the fear gage has broken out. Stocks have been on a tear as of late but unfortunately to the downside. No one is surprised that the markets have become extremely volatile due to the Russian invasion of Ukraine. The Dow Jones Industrial Average (see chart here) fell over 10% since the crisis began as has the S&P 500 (see chart here). Both the Nasdaq Composite (see chart here) and the small-cap Russell 2000 (see chart here and below) have sold off closer to 15% before bouncing off of their sell-off lows. Again, no surprise that vol has spiked to almost a double over the past few weeks as tensions increased.

Before we get into the technical shape of the markets it’s hard for me to even talk stocks and indexes due to the atrocities happening abroad. Our prayers go out to everyone in the Ukraine that is being affected by this invasion and for the people of Russia who wants no part of this. Hopefully very soon a cease fire will happen and happen for good!

Now let’s look at the technical set-up that has occurred since the buildup and invasion with the aforementioned key indexes. Starting with the Dow Jones Industrial Average (see chart here). The Dow a few days ago hit a low of 32272 and has bounced to the 34,000 zone. There is much more work here to be done before the Dow can recapture its 100 and 200-day moving averages. The same can be said for the S&P 500 (see chart here) although with the S&P, it is closer to its 20-day M/A than the Dow Jones Industrials Average. Interestingly both the Nasdaq Composite (see chart here) and the small-cap Russell 2000 (see chart here) have bounced off of their recent lows stronger with the Russell 2000 recapturing its 20-day M/A. Despite the recent bounces off of their sell-off lows I think it is fair to say that we are not out of the woods yet in the volatility we have seen as of late. If you are a long-term investor, this will pass at some point in time. For experienced traders this is an environment where money can be made both on the long and short side of the markets. That said, I always recommend consulting your certified professional financial advisor(s) before making any moves in the backdrop we currently find ourselves.

Good luck to all šŸ™‚

~George

Volatility Hits The Markets - Paula Mahfouz

A Ho Hum Q1…

It doesn’t seem like it, but for the first quarter of the year the four major averages were essentially flat. For the quarter, the Dow Jones Industrial Average (chart) closed basically unchanged, the tech heavy Nasdaq (chart) finished up just over 1% percent, the S&P 500 (chart) +2.2% and the small-cap Russell 2000 (chart) closed out Q1 slightly up. Quite an uneventful quarter at least from a P&L standpoint especially considering China’s economic slow down and the Ukraine crisis that unfolded in the quarter. There was a period in late January in which we saw a sharp 5% decline only to be met with unconditional support, followed by a rally which led the markets back to almost unchanged on the year.

As I always do at the end of each quarter, I look at the technical conditions of the aforementioned indexes and how they are shaping up going into a new quarter. There are plenty ofĀ market technicians out there that use a variety of techniques and indicators to identify trends and where the markets may be headed. My preference is to keep things as simple as possible when conducting technical analysis. As you may know by now, two of my favorite technical indicators are the Ā Relative Strength IndexĀ also know as theĀ RSIĀ and theĀ moving averages. Part of the reason why I prefer these two reliable indicators over most is it is now seemingly more than everĀ computerized trading models are emphasizing the RSI and the 20-day, 50-day, 100 and 200-day moving averages in their models. These indicators also have been a long time favorite of institutional investors. So it’s no wonder that when theĀ Relative Strength IndexĀ (RSI)Ā is indicating an overbought or oversold condition in an index or equity, more times than not, the asset finds support and changes direction. The same can be said for theĀ moving averages, whenever a stock or index bumps up against or comes down to its moving average, typically the stock or index finds support or resistance.

Letā€™s break this down in more detail starting with theĀ (RSI),Ā TheĀ RSIĀ is designed to demonstrate whether or not an index or equity is overbought or oversold, depending on certain value levels. According to theĀ RSIĀ principle, the 70 value level or greater, is an overbought condition and the 30 value and below is an oversold condition. Looking at the aforementioned indices now, there is no indication of an overbought or over sold condition. However, both the Nasdaq (chart) and the small-cap Russell 2000 (chart) are trading and have closed below their 50-day moving averages. These two indices have been leading the markets higher and now comparatively speaking, they have begun to lag, a potential short term ominous sign. Now it has only been a couple of days that both of these indexes have been trading below this support line so we will have to wait and see if this turns into a longer term trend.

That said, we will not have to wait much longer. This Friday’s jobs report will shed light as to the health of the labor market and don’t look now but Q1 earnings reporting season is on deck. Without a doubt, Q1 earnings reporting season will be placed under a microscope to see if corporate America and the markets deserve their current valuations. Personally, I think a rather healthy pullback may be in the cards for equities and if so, most likely, the trend of unconditional support will come back into the markets as well.

Good luck to all. šŸ™‚

~George

Global Concerns Give Markets A Pause…

Stocks had a very volatile week as tensions elevated in Ukraine and now China has seemingly hit a soft patch in its economy. For the week, the Dow Jones Industrial Average (chart) fell 2..35%, the Nasdaq (chart) gave back 2.09%, the S&P 500 (chart) -1.96% and the small-cap Russell 2000 (chart) ended the week lower by 1.82%. I do not think the most recent retreat in stocks is anything beyond the current global headline risks as our own economy appears to be intact and growing, albeit modestly. Some economists believe China will maintain a 7.5% growth rate this year while other pundits believe a cooling off of China’s economy would affect our markets here. Should the latter be the case, I would assume the Chinese government would take measures to help prop up their economy by injecting enough stimulus to ensure the targeted 7.5% growth rate for 2014 would not be breached. Recently, the economic numbers across the board coming out of China has been weaker than expected, especially in the manufacturing and export sectors.

This past week also saw an escalation in the crisis in Ukraine with both sides increasing the chatter about a potential military conflict as protests have become extremely violent. Governments from around the world are now are attempting to assist in the negotiations with Russia and Ukraine to formalize some type of accord. So it’s no surprise that a “risk off” mentality has come into the markets for the time being. I do believe that once things settle down in the Ukraine and the China headlines become less frequent, we could consolidate here for a bit as the first quarter of the year winds down. Then of course as we enter into April, all eyes will be watching how corporate America fared during the first quarter as Q1 earnings reporting season will begin. Between now and the end of March, I will be paying closer attention to our own economic data which will most likely translate into companies Q1 earnings reports.

Technically speaking, the Dow Jones Industrial Average (chart), the Nasdaq (chart), the S&P 500 (chart) and the Russell 2000 (chart) all appear to be heading towards their respective 50-day moving averages, in fact the Dow (chart) Ā actually breached its 50-day on Friday. The 50-day moving average is a technical indicator I favor as do other certain market technicians. Historically, when stocks or indexes reach their 50-day or 200-day moving averageĀ for that matter, support is typically found and a reversal of the stock or index ensues. The moving averages are also followed by certain institutional investors and select computerized algorithmic trading models, which could also be a reason why the moving averages can act as a support mechanism. Now I am not suggesting that the moving averages are infallible, I personally utilize this indicator mainly from a technical standpoint to help me navigate current market opportunities. Good luck to all.

Have a great weekend šŸ™‚

~George