Stocks In Whipsaw Action!
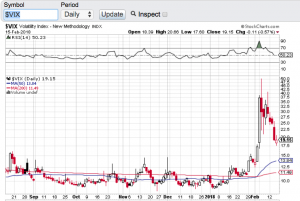
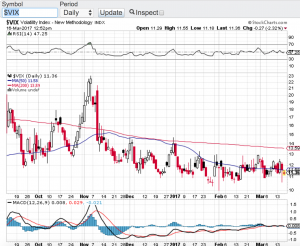
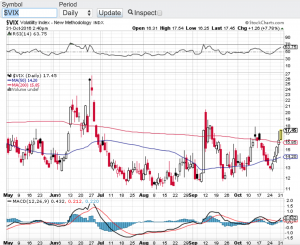
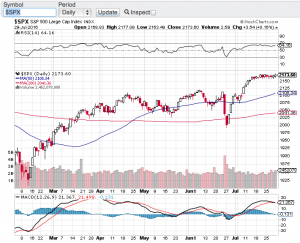
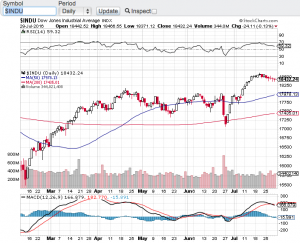
Volatility makes a comeback as stocks get whipsawed to end the month. The Dow Jones Industrial Average (chart) closed out the month of February with a 380 point loss, the S&P 500 (chart) retraced 30 points, the Nasdaq Composite (chart) dropped 57 points and the small-cap Russell 2000 (chart) closed the last day of February down 24 points. This two-day pull back comes off the heals of a sharp V shape bounce from the market correction that occurred in early February. During the bounce off of the most recent bottom it sure started to feel like the good ole days of lower vol and melt up mode. Not this time and at least not yet. What was abnormal was how volatility was virtually non existent over the past few years. Seemingly passive investing was the only place to be and in hindsight that was indeed the only place to be. During the multi-year melt-up we watched hedge funds underperform and in some instances close shop. There was simply no volatility for hedge funds hedge. It was a one way ticket up.
So what has changed you may ask? I think it is safe to say that the shift in the Federal Reserve’s policy albeit a delicate one is as far as you have to look. Since the financial crisis of 2008, the Federal Reserve has provided its entire war chest of financial accommodation to get the economy and banking system not only of its feet, but thriving again. So now that all systems are a go the Fed is unwinding its balance sheet and raising interest rates. Yes that sounds like a pretty simple answer but it’s also pretty clear to see. With that being said, I do not expect the Federal Reserve to act too quickly unless inflation abruptly takes off. In the meantime I believe volatility will be remain prominent in the marketplace which is putting a smile on traders faces and creating opportunity both long and short. 🙂 Good luck to all!
~George