Earnings Take Center Stage…

Earnings reporting season begins in earnest this week which could play a role in determining whether or not the bull market has more room to run. This past Friday the money center banks kicked off the reporting season as JP Morgan Chase (NYSE: JPM) and Bank of America (NYSE: BAC) recorded eye popping profits while Wells Fargo (NYSE: WFC) continues to deal with the aftermath of the “fake-accounts” debacle that rocked the bank last year.

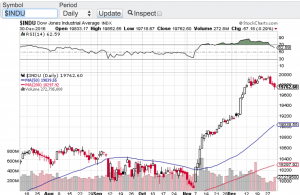
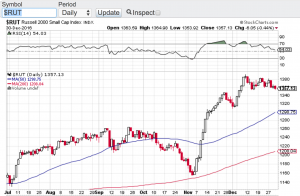
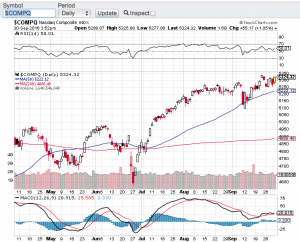
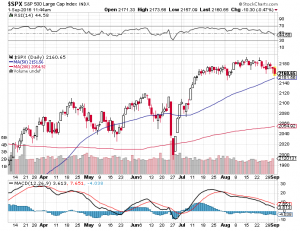
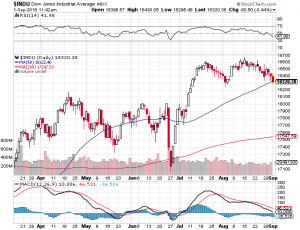
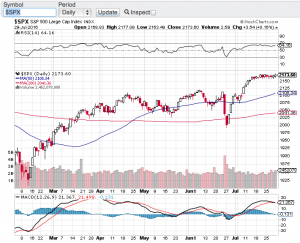
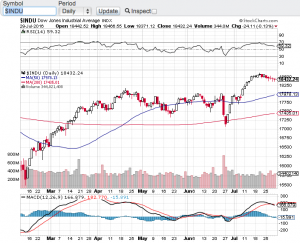
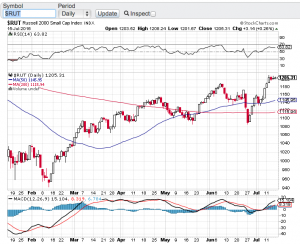
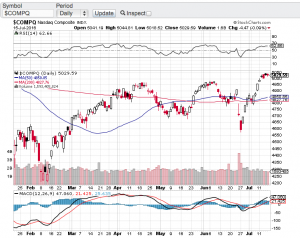
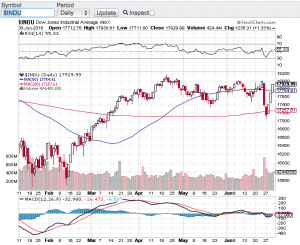
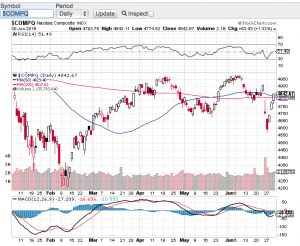
As I look at the charts of the key indexes, I do see a potential technical catalyst looming. The Dow Jones Industrial Average (chart), the S&P 500 (chart) and the small-cap Russell 2000 (chart) all share similar and current chart patterns. Over the past month or so, these key indices have been consolidating and trading in a tight range and when you have a looming catalyst such as earnings reporting season, most likely this pattern will breakout or breakdown. The Nasdaq (chart) does not fit this consolidation profile yet as it has been making new highs and leading the pack so far this year. Another technical set-up I look for is overbought or oversold conditions. Seemingly we have been in overbought conditions since the election but technically we are not according to the relative strength index also known as the RSI.

In my previous blog I did write about my expectation of increased volatility as we headed into January and earnings reporting season and how to hedge yourself against such volatility. To my surprise, vol has remained relatively low so far, however, there are catalysts looming as described above. As far as protecting a portfolio against any future volatility, there are many ways to do so but the most effective and simplest way is to buy S&P 500 puts. Especially while vol is low and premiums are relatively cheap. So if you have a “long only” portfolio buying some protection in the form of S&P 500 put options might not be a bad idea. Of course it is always best to consult a certified financial planner(s) before making any investment decisions or any adjustments to your current portfolio. My goal is to bring light to strategies that can be helpful to you that certain managers might not cover.

Good luck to all 🙂

~George


Happy New Year!

Happy New Year to all and what a year of celebration for the bulls in 2016. The major averages last year notched very impressive gains. The Dow Jones Industrial Average (see chart below) finished the year up 2,337 points or 13.42%, the tech focused Nasdaq (click here for chart) closed up on the year 376 points or 7.5%, the S&P 500 (click here for chart) closed up 194 points or 9.54% and the small-cap Russell 2000 (see chart below) finished out 2016 up a whopping 221 points or almost a 20% gain outperforming most benchmarks. This eye-popping rally really kicked into high gear after the stunning upset victory Donald Trump pulled off over Hillary Clinton in the presidential election. So that was last year, now let’s take a look at 2017 and what lies ahead.

I begin with the obvious. Markets are certainly overbought and have been since the November 8th election results. Then in December, the Federal Reserve raised interest rates for the first time in a year and then added language for an additional rate hike in 2017 to bring the total projected rate hikes this year to at least three. Historically a rising interest rate environment puts pressure on equities and in particular the high beta names. Consensus has it that the Fed will move slowly to avoid any shocks to the economy or the markets. However, with Donald Trump’s proposed economic pro-growth policies, debt and inflation should rise. So I am sure the Federal Reserve will be keeping a close eye on how inflation ticks up as 2017 unfolds. Should inflation rise faster than anticipated this too could be a challenge for the Fed and our stock market.

So based on our current market environment it is my view that volatility will not only pick up in January but the recipe described above signals potential elevated volatility throughout the year. We also will begin to hear from corporate America this month as we head into earnings reporting season. I would expect earnings from multi-national companies to be a bit challenged due to the continuing and significant strength that the U.S. dollar has been exhibiting. That said, there will be opportunities abound in this new year but I am preparing to embrace volatility and hedge my positions going forward. In my next blog I will talk about hedging strategies in order to offset the impact of potential increased vol. Until then, both Paula and I wish everyone the happiest and healthiest new year to all. 🙂

~George

Dow Jones chart Paula MahfouzRussell 2000 post george mahfouz jr


As Expected, The Fed Raises Rates…

To no surprise, the Federal Reserve raised interest rates 1/4 point today citing stronger economic growth and a pick-up in inflation. A stronger job market also played a role in the decision of the Fed. What wasn’t quite expected was the language of an additional anticipated rate hike from the projected two hikes in 2017 to now three. This might of caused the slight sell-off yesterday in the markets with the Dow Jones Industrial Average (chart) falling 118.68 points, the S&P 500 (chart) was lower 18.44 points, the Nasdaq (chart) fell 27.15 points and the small-cap Russell 2000 (chart) retraced by 17.51 points.

With all things considered, this pullback was long overdue. In fact, I am surprised that the markets held up like they did yesterday. Especially considering the rip roaring rally most equities have enjoyed since the presidential election. Markets have been on fire with the Dow Jones Industrials (chart) gaining almost 1,600 points, the S&P 500 (chart) ripping 125 points, the Nasdaq (chart) catapulting about 300 points and the small-cap Russell 2000 (chart) up a staggering 170 points. What a breathtaking rally in such a short period of time.

So what can we expect between now and year end? Let’s think about this for a minute. If you are an institutional investor, fund manager, hedge fund or the like would you be taking profits into year end? Or would you wait until we get into the new year knowing that capital gains taxes and corporate taxes are coming down? I think it is fair to say the latter would make the most sense. Add into the mix the rotation that continues out of the bond market and into equities in which certain pundits believe we are in the fourth or fifth inning of that rotation, one has to ascertain that this bull market has more room to run.

Whatever the case I think pullbacks will be bought as momentum continues into year-end. Paula and I wish everyone the happiest and healthiest holiday season 🙂

~George

The Trump Rally Continues…

Caught off guard! I think this phrase wraps it up. After Donald Trump won the presidential election both voters and markets were caught off guard. The polls all but had Hillary as a shoe in for the oval office. Instead the exact opposite occurred not only with the election but how wrong the markets had it if Donald Trump pulled it off. Not only did the markets not crater, (although last Tuesday evening when the voting results were coming in the futures were tanking) stocks are back to setting records. Since the election, the Dow Jones Industrial Average (chart) hit an all-time high of 18,934, the S&P 500 (chart) is within striking distance of its all-time high, the small-cap Russell 2000 (chart) also hit an all-time high, however, the tech focused Nasdaq (chart) is lagging a bit due to the uncertainty of the new Trump administration policies on trade and how this could affect the technology space.

It has been quite a while since the markets have responded in such a bullish manner. Today marks the 7 straight day of gains for the Dow Jones Industrial Average (chart) led by industrials and banks. The banking index has exploded due to the hope that the Trump administration will relax or reverse the Dodd-Frank act which places overbearing regulations on the financial industry as a whole. Check out one of the most widely held bank exchange traded funds Symbol: XLF (chart). This ETF has moved up over 10% in the past week alone, simply unheard of. Other benefactors to the Trump presidency is anything and everything in infrastructure and materials. Trump pledges to spend over $1 trillion dollars rebuilding America’s infrastructure to include highways, roads, bridges, airports etc. It’s no wonder the markets are setting records once again.

Now what? Without question Trump winning the election is seemingly good the for the economy and so far for the stock market. However, as with any rally or sell-off for that matter, “reversion to the mean” typically occurs. I would be very careful chasing this rally or deploying any new capital. My preference is to wait until the inevitable pullbacks occur and look at the aforementioned sectors to consider any new positions. Of course it is always prudent to consult with a certified financial planner(s) before making any investment decisions. Good luck to all 🙂

~George

A Spooky Time For Stocks?

As Halloween fast approaches is this also a spooky time for stocks? Without question volatility has picked back up which to me is no surprise at all. Factor in all of the headlines out of Europe, earnings reporting season here at home and last but not least, the daily Hillary Clinton and Donald Trump show. It’s no wonder stocks are bouncing around all over the place. For the week, the Dow Jones Industrial Average (chart) closed lower by one half of one percent, the Nasdaq (chart) closed off by 1.5%, the S&P 500 (chart) -1.0% and the small-cap Russell 2000 (chart) lead the pack and finished the week lower by 2%. With all of the headlines and headwinds for that matter, I still remain quite impressed by the resiliency of stocks despite facing a multitude of uncertainties.

This upcoming week should also be a doozy as earnings reporting season kicks into high gear. Starting off the week, Bank of America (NYSE: BAC) will release their quarterly results followed by International Business Machine (NYSE: IBM), Goldman Sachs (NYSE: GS), Intel Corp (NasdaqGS: INTC), Johnson & Johnson (NYSE: JNJ), American Express (NYSE: AXP), Ebay (NasdaqGS: EBAY), Morgan Stanley (NYSE: MS), American Airlines (NasdaqGS: AAL), Microsoft Corp (NasdaqGS: MSFT), Paypal Holdings (NasdaqGS: PYPL), Verizon Communications (NYSE: VZ), General Electric (NYSE: GE), Honeywell (NYSE: HON) and McDonald’s Corp just to name a few. Expectations for this earnings reporting season is subdued and any upside surprise could bode well for sentiment during these volatile times.

Let’s take a quick look at the technical shape of the aforementioned indices and all but the small-cap Russell 2000 appear to be finding support either at their 50-day or 20-day moving averages.  The small-cap Russell 2000 (chart) does appear to be breaking down at an accelerated rate however, it does appear that the 1200 level of the Russell 2000 should be met with a bit of support.

Both Paula and I wish everyone a very safe and Happy Halloween and good luck to all. 🙂

~George


Uncertain Times And Near Record Highs!

Despite the uncertain times we find ourselves in vis-à-vis the upcoming presidential election, the Deutsche Bank balance sheet and liquidity concerns and the upcoming third quarter reporting season, stocks continue to defy the odds and remain within striking distance of all-time highs. The Dow Jones Industrial Average (chart) closed the third quarter at 18308, the tech-focused Nasdaq (see chart below) closed at 5312, the broad based S&P 500 (chart) finished the quarter at 2168 and the small-cap Russell 2000 (chart) closed at 1251.

I am truly amazed how strong the markets have been all things considered. We did see volatility spike in September which was no surprise. However, what was surprising is how short lived it was especially with how much concern and risk there is out of Europe and in particular Deutsche Bank. A couple of weeks ago the U.S. Department of Justice announced they were seeking a $14 billion dollar fine to settle Deutsche Bank’s mortgage lending activities during the 2008 housing crisis. Shares of Deutsche Bank stock plummeted on the news and raised concerns about the solvency of the bank. Stocks did react to the news but have seemingly shrugged off this potential risk to the markets. Furthermore, stocks so far have also shrugged off the uncertainty due to the upcoming presidential election. Monday’s presidential debate sparked controversy as to who won it, but it is clear that the markets saw that Hillary Clinton won the first round.

As we now enter the month of October, without question the headlines and chatter will only increase as we get closer to election day which is November 8th. I am expecting volatility to not only increase but to last longer than usual due to the amount of news flow that is forthcoming which includes the launch third quarter earnings reporting season. What I do in this type of market environment is tune out the noise and stay focused on the fundamentals and technicals of select stocks and indexes. I seek out and identify market dislocations including overbought and oversold conditions. My assumption is that as we get in the thick of third quarter earnings reporting season, overbought and for that matter oversold opportunities will present themselves. Good luck to all 🙂

~George


nasdaq chart george mahfouz jr

All Eyes On Jobs Report…

The chatter has increased lately as to when the Federal Reserve will raise interest rates from their historic lows. We may not need to wait much longer to get that answer. Although it is a holiday weekend, the August jobs report will be released tomorrow and the pundits are suggesting that if the economy added more than 200,000 jobs in August, the Federal Reserve will raise rates this month. From my view a quarter point rate hike here in September is no big deal. I think the markets will have a muted reaction. However, if this is the beginning of a consistent pattern then this becomes an entirely different discussion. I do not expect that the Fed will be too aggressive with future rate hikes and of course the economic data will play a role in those decisions.

So what about the markets? We are coming into a seasonality that is typically a weaker time for stocks. What’s more, the markets will also begin to focus on the presidential election and the polls associated with it. That said, I expect an increase in volatility as we head into the fall. There are other catalysts that could weigh in on stocks such as potential changes in global monetary policies and Q3 earnings reporting season in October. The key indices continue to demonstrate strength with the S&P 500 (see chart below) being supported by its 50-day moving average click here, the Dow Jones Industrial Average (see chart below) is within a couple percentage points of its all-time highs, and both the Nasdaq (chart, click here) and the small-cap Russell 2000 (chart, click here) are trading right around their 20-day moving averages. So as of yet, stocks do not appear to be too concerned with the upcoming market seasonality and other potential catalysts that could play a role in interrupting the uptrend we have been in.

Both Paula and I wish everyone a very safe and happy Labor Day weekend 🙂

~George

S&P chart george mahfouz jr

dow jones chart george mahfouz jr

Is It Time For A Breather?

Stocks have been on a tear since the end of June with the key averages gaining close to 10% or more since coming off of their late June lows. That’s right double digit gains in a little over a month lead by the Nasdaq (chart) which is almost up 13%, followed by the small-cap Russell 2000 (chart) up 12.35% and both the S&P 500 (see chart below) and the Dow Jones Industrial Average (see chart below) closing up nearly 10% in that same time period. Part of the reason why the tech focused Nasdaq has led the charge is the stronger than expected and recently announced quarterly earnings results out of Amazon (NasdaqGS: AMZN) Apple (NasdaqGS: AAPL), Facebook (NasdaqGS: FB) and Google aka Alphabet (NasdaqGS: GOOGL).

So the question now is after such dramatic double digit gains in the aforementioned indices and in such a short period of time, is it time for a pause and/or a retracement? As you all know by now, the first thing that I look at when it comes to accelerated gains in any stock or index is the relative strength index also known as the RSI. The relative strength index is a technical indicator to determine overbought or oversold conditions, click here  for the complete definition. The RSI is also one of the favorite technical indicators used by market technicians, certain money managers and even select algorithms have the RSI programmed into their model. That said, the Nasdaq has now hit the 70 value level of the RSI which is an overbought level according to the RSI while the other key indices are not too far behind. Please note that indexes and stocks can remain overbought for extended periods of time.

So what does all of this mean? Well I think the set-up now is a little spooky. Not only are we at or approaching overbought conditions according to the relative strength index, but we now find ourselves in the month of August. August historically tends to be one of weakest month of the year for equities. In fact, over the past seven years the key indexes have fallen each year during this time period. History doesn’t always have to repeat itself, but the current set-up bodes well for a softer month ahead. We will see. Good luck to all 🙂

~George

S&P 500 George Mahfouz Jr

Dow Jones Chart George Mahfouz Jr

Record Setting Week!

A three-week stock market winning streak has propelled the Dow Jones Industrial Average (chart) and the S&P 500 (chart) to close at record highs. In one of the most dramatic turn of events from the shocking Brexit vote to today, these key indices were breaking records all week long. The Nasdaq (see chart below) and the small-cap Russell 2000 (see chart below) also posted a strong week of gains.

I stand corrected! In my previous blog I referred to the fact that the S&P 500 (chart) had been stuck in a trading range and that upcoming earnings reporting season should act as the catalyst to break stocks out of this range. Furthermore, my view was that corporate earnings most likely would underperform hence a breakdown out of this trading would be more probable. Well here we are today at record highs and we haven’t even gotten into the bulk of earnings reporting season. The largest U.S. bank J.P. Morgan (NYSE: JPM) did however report their results this past week posting a profit of $6.2B. J.P. Morgan’s results came in stronger than expected which also helped fuel this week’s rally, especially in the banking sector.

As much as we were oversold leading up to and just after the Brexit vote, the markets now find themselves approaching overbought territory. Now the question becomes what to do next? As mentioned above, we are full steam ahead into the bulk of earnings reporting season which can come with plenty of surprises. From a technical standpoint I find it hard to commit any new capital into a market at record highs and do so with most of corporate America yet to report their results. I will be paying attention to the top-line growth of companies to get more of an accurate read how their business is fairing compared to their bottom line which can be adjusted in many ways that may not tell the whole story. My concern now is how can record highs continue if top-line growth is not there in a meaningful way? Let’s look to next week to see if the record setting trend continues, or a pause and reversal comes forward.

Good luck to all 🙂

~George

George Mahfouz Jr. Russell 2000 chart

george mahfouz jr Nasdaq chart

What A Rollercoaster Ride!

This week started off with the vote no one expected. Global markets were shocked with the outcome of the United Kingdom’s vote to the leave the European Union. Here at home, the Dow Jones Industrial Average (see chart below) lost close to 1,000 points between Monday and Tuesday, the Nasdaq (see chart below) over that same two-day period lost close to seven percent as did the S&P 500 (chart) and the small-cap Russell 2000 (chart). A breathtaking 2-day drop which was so swift and profound that it violated the 200-day moving averages of all of the aforementioned indexes. Fast forward to today and what seemingly was the start of an angry correction, has turned into yet another “buy the dip” opportunity. No matter what the challenges are or have been on the macro-economic or political front, markets over the past several years have shrugged them off. I honestly did not think stocks would snap back this time as quickly and as powerfully as they have.

Yet again, oversold conditions created a trader’s dream with this snap-back rally. Ever since this bull market began, every shocking or unexpected headline which have rattled the markets have always been met with strong support that then turns into the resumption of this protracted bull market. However, it is also very clear that we have been trading in a range for quite some time now and every time we have tried to breakout of this trading range, resistance is met and we retrace back to a variety of moving averages.

So you may be asking how do we break out of this S&P 500 (chart) 2000 to 2120 trading range? One catalyst that can do this is the upcoming second quarter earnings reporting season which kicks off here in July. I do not think that the economy is such that record earnings results will come forward. In fact, companies may take it upon themselves to use the Brexit circumstance to soften their future guidance? We will see. In my humble opinion I think the possibility of a downward break is more probable in the near term than stocks breaking out to all-time highs, especially after this snap back rally. Good luck to all!

Paula and I wish everyone a safe and Happy 4th of July holiday 🙂

~George Mahfouz, Jr.
Dow Jones George Mahfouz JrNasdaq George Mahfouz Jr.