Uncertain Times And Near Record Highs!

Despite the uncertain times we find ourselves in vis-à-vis the upcoming presidential election, the Deutsche Bank balance sheet and liquidity concerns and the upcoming third quarter reporting season, stocks continue to defy the odds and remain within striking distance of all-time highs. The Dow Jones Industrial Average (chart) closed the third quarter at 18308, the tech-focused Nasdaq (see chart below) closed at 5312, the broad based S&P 500 (chart) finished the quarter at 2168 and the small-cap Russell 2000 (chart) closed at 1251.

I am truly amazed how strong the markets have been all things considered. We did see volatility spike in September which was no surprise. However, what was surprising is how short lived it was especially with how much concern and risk there is out of Europe and in particular Deutsche Bank. A couple of weeks ago the U.S. Department of Justice announced they were seeking a $14 billion dollar fine to settle Deutsche Bank’s mortgage lending activities during the 2008 housing crisis. Shares of Deutsche Bank stock plummeted on the news and raised concerns about the solvency of the bank. Stocks did react to the news but have seemingly shrugged off this potential risk to the markets. Furthermore, stocks so far have also shrugged off the uncertainty due to the upcoming presidential election. Monday’s presidential debate sparked controversy as to who won it, but it is clear that the markets saw that Hillary Clinton won the first round.

As we now enter the month of October, without question the headlines and chatter will only increase as we get closer to election day which is November 8th. I am expecting volatility to not only increase but to last longer than usual due to the amount of news flow that is forthcoming which includes the launch third quarter earnings reporting season. What I do in this type of market environment is tune out the noise and stay focused on the fundamentals and technicals of select stocks and indexes. I seek out and identify market dislocations including overbought and oversold conditions. My assumption is that as we get in the thick of third quarter earnings reporting season, overbought and for that matter oversold opportunities will present themselves. Good luck to all 🙂

~George
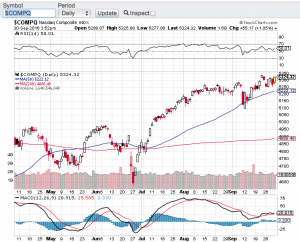
 

nasdaq chart george mahfouz jr

Stocks Go On A Bumpy Ride…

The stock market ended the week eking out slight gains. For the week, the Dow Jones Industrial Average (chart) closed higher by 0.6%, the Nasdaq (chart) barely closed in the green on the week, the S&P 500 (chart) closed up 0.7% and the small-cap Russell 2000 (chart) finished the week up one half of one percent. I guess this could be viewed as a big win for the key indices considering how light crude oil (chart) has plummeted recently which directly correlates to the energy industry as a whole. Energy stocks have also gotten crushed along with oil which is why I think it’s rather impressive that aforementioned indexes were able to end the week in positive territory. However, volatility (chart) is continuing to spike and the 200-day moving average on the S&P 500 (chart) continues to get challenged. Some pundits believe that it’s only a matter of time that the 200-day on the S&P (chart) will not hold much longer, however, if you look back, no one can deny how this technical metric has been a pillar of support for this most watched index.

So what does an investor or trader do in this historically weak month for stocks and with volatility spiking now weekly? For me personally, I am not as active in the markets due the volatility spikes and typically lower volumes associated with the summer month of August. I prefer to spend my time in research identifying opportunities in the marketplace. For instance, watching the oil markets unravel the way that they have, without question opportunities are forthcoming in this space. The majority of individual energy stocks do indeed trade with the price of oil (chart) and to predict when the price of oil will stabilize is almost impossible. However, at some point in time oil will indeed stabilize and a plethora of opportunity will surface. If you do not want to take the risk on individual names, you can always consider the most popular ETF that tracks the energy space (symbol: XLE). This equity energy fund has an approximate $11.69 billion in net assets with holdings in some of the largest and most respected energy companies in the world. Of course and as I always recommend, it is always best practice to consult with a certified financial planner(s) that you feel comfortable and confident with before making any investment decisions. Good luck to all 🙂

~George

Late April Sell-Off Wakes Up The Bears…

Stocks sold off sharply on the last trading day of April. The Dow Jones Industrial Average (chart) fell 195 points, the Nasdaq (chart) closed down 82.22 points, the S&P 500 (chart) lost 21.34 points and the small-cap Russell 2000 (chart) finished lower by 26.83 points. The biotech sector has lead the charge in this most recent selloff with the most popular biotech ETF (Symbol: IBB) (chart) losing over 10 percent of its value since mid-March. Another factor in this sell-off is the sloppy earnings reporting season we find ourselves in. Just this week both Twitter (NYSE: TWTR) and Linkedin (NYSE: LNKD) surprised the street with their weak quarterly results and even weaker forward guidance. So the selling pressure is not just in the biotech space, it has now spilt over to the technology sector as a whole. That said, this morning there may be a bit of a respite with the futures market pointing up sharply.

Let’s take a look at the technical shape of the markets as we now enter into May. One troubling sign is the four major averages mentioned above have all breached their 50-day moving average line, with the small-cap Russell 2000 falling prominently below it. Let’s see if these key indices remain below this popular technical indicator for more than a few days. A one day breach does not necessarily mean a total technical breakdown however, another slight concern of mine is that these averages are not oversold yet according to the relative strength index or the RSI. Click here for the definition of the RSI. Now take a look at the charts of the Dow (chart), Nasdaq (chart), S&P 500 (chart) and the Russell 2000 (chart) and you will see at the very top of the chart the plot of the relative strength index and you will further see that these indexes have more room to go to reach the 30 value level of the RSI, which is the level that qualifies an oversold condition. Now throw into the mix that May is historically a weak month for equities and we indeed be in for some additional selling pressure.

In closing, I will re-visit the technical make-up of the markets in mid-May and see where there could be some buying opportunities. Good luck to all 🙂

~George