Is It Time For A Breather?

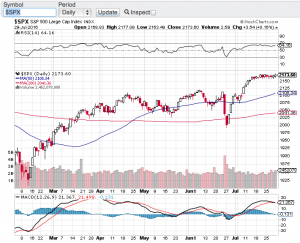
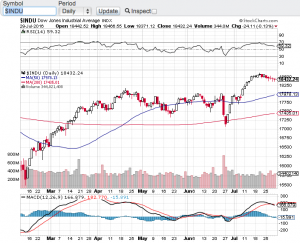
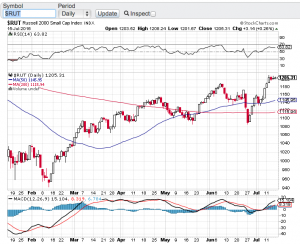
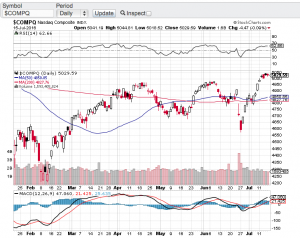
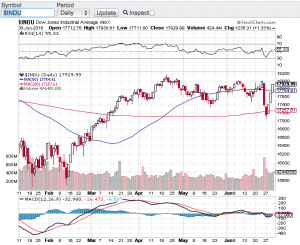
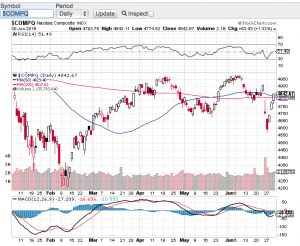
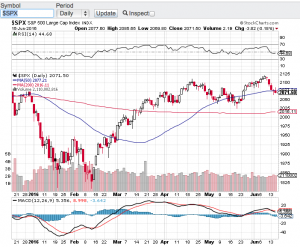
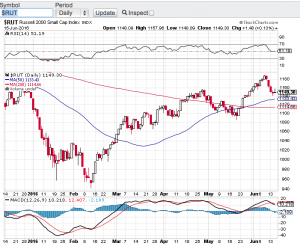
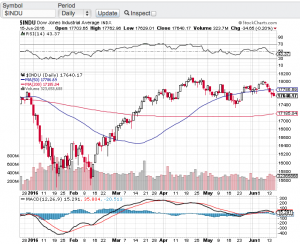
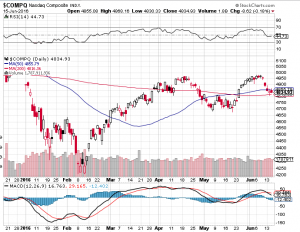
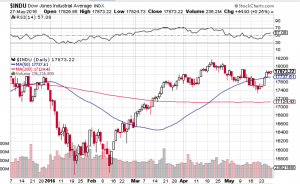
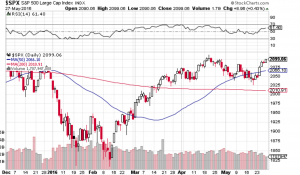
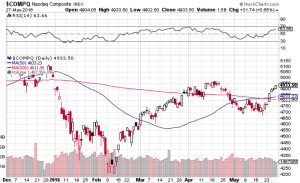
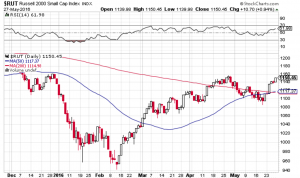
Stocks have been on a tear since the end of June with the key averages gaining close to 10% or more since coming off of their late June lows. That’s right double digit gains in a little over a month lead by the Nasdaq (chart) which is almost up 13%, followed by the small-cap Russell 2000 (chart) up 12.35% and both the S&P 500 (see chart below) and the Dow Jones Industrial Average (see chart below) closing up nearly 10% in that same time period. Part of the reason why the tech focused Nasdaq has led the charge is the stronger than expected and recently announced quarterly earnings results out of Amazon (NasdaqGS: AMZN) Apple (NasdaqGS: AAPL), Facebook (NasdaqGS: FB) and Google aka Alphabet (NasdaqGS: GOOGL).

So the question now is after such dramatic double digit gains in the aforementioned indices and in such a short period of time, is it time for a pause and/or a retracement? As you all know by now, the first thing that I look at when it comes to accelerated gains in any stock or index is the relative strength index also known as the RSI. The relative strength index is a technical indicator to determine overbought or oversold conditions, click here  for the complete definition. The RSI is also one of the favorite technical indicators used by market technicians, certain money managers and even select algorithms have the RSI programmed into their model. That said, the Nasdaq has now hit the 70 value level of the RSI which is an overbought level according to the RSI while the other key indices are not too far behind. Please note that indexes and stocks can remain overbought for extended periods of time.

So what does all of this mean? Well I think the set-up now is a little spooky. Not only are we at or approaching overbought conditions according to the relative strength index, but we now find ourselves in the month of August. August historically tends to be one of weakest month of the year for equities. In fact, over the past seven years the key indexes have fallen each year during this time period. History doesn’t always have to repeat itself, but the current set-up bodes well for a softer month ahead. We will see. Good luck to all 🙂

~George

S&P 500 George Mahfouz Jr

Dow Jones Chart George Mahfouz Jr

Record Setting Week!

A three-week stock market winning streak has propelled the Dow Jones Industrial Average (chart) and the S&P 500 (chart) to close at record highs. In one of the most dramatic turn of events from the shocking Brexit vote to today, these key indices were breaking records all week long. The Nasdaq (see chart below) and the small-cap Russell 2000 (see chart below) also posted a strong week of gains.

I stand corrected! In my previous blog I referred to the fact that the S&P 500 (chart) had been stuck in a trading range and that upcoming earnings reporting season should act as the catalyst to break stocks out of this range. Furthermore, my view was that corporate earnings most likely would underperform hence a breakdown out of this trading would be more probable. Well here we are today at record highs and we haven’t even gotten into the bulk of earnings reporting season. The largest U.S. bank J.P. Morgan (NYSE: JPM) did however report their results this past week posting a profit of $6.2B. J.P. Morgan’s results came in stronger than expected which also helped fuel this week’s rally, especially in the banking sector.

As much as we were oversold leading up to and just after the Brexit vote, the markets now find themselves approaching overbought territory. Now the question becomes what to do next? As mentioned above, we are full steam ahead into the bulk of earnings reporting season which can come with plenty of surprises. From a technical standpoint I find it hard to commit any new capital into a market at record highs and do so with most of corporate America yet to report their results. I will be paying attention to the top-line growth of companies to get more of an accurate read how their business is fairing compared to their bottom line which can be adjusted in many ways that may not tell the whole story. My concern now is how can record highs continue if top-line growth is not there in a meaningful way? Let’s look to next week to see if the record setting trend continues, or a pause and reversal comes forward.

Good luck to all 🙂

~George

George Mahfouz Jr. Russell 2000 chart

george mahfouz jr Nasdaq chart

What A Rollercoaster Ride!

This week started off with the vote no one expected. Global markets were shocked with the outcome of the United Kingdom’s vote to the leave the European Union. Here at home, the Dow Jones Industrial Average (see chart below) lost close to 1,000 points between Monday and Tuesday, the Nasdaq (see chart below) over that same two-day period lost close to seven percent as did the S&P 500 (chart) and the small-cap Russell 2000 (chart). A breathtaking 2-day drop which was so swift and profound that it violated the 200-day moving averages of all of the aforementioned indexes. Fast forward to today and what seemingly was the start of an angry correction, has turned into yet another “buy the dip” opportunity. No matter what the challenges are or have been on the macro-economic or political front, markets over the past several years have shrugged them off. I honestly did not think stocks would snap back this time as quickly and as powerfully as they have.

Yet again, oversold conditions created a trader’s dream with this snap-back rally. Ever since this bull market began, every shocking or unexpected headline which have rattled the markets have always been met with strong support that then turns into the resumption of this protracted bull market. However, it is also very clear that we have been trading in a range for quite some time now and every time we have tried to breakout of this trading range, resistance is met and we retrace back to a variety of moving averages.

So you may be asking how do we break out of this S&P 500 (chart) 2000 to 2120 trading range? One catalyst that can do this is the upcoming second quarter earnings reporting season which kicks off here in July. I do not think that the economy is such that record earnings results will come forward. In fact, companies may take it upon themselves to use the Brexit circumstance to soften their future guidance? We will see. In my humble opinion I think the possibility of a downward break is more probable in the near term than stocks breaking out to all-time highs, especially after this snap back rally. Good luck to all!

Paula and I wish everyone a safe and Happy 4th of July holiday 🙂

~George Mahfouz, Jr.
Dow Jones George Mahfouz JrNasdaq George Mahfouz Jr.

Looks Like A Double Top…

A recent attempt to breakout to all-time highs has seemingly failed. The Dow Jones Industrial Average (see chart below) , the tech-focused Nasdaq (see chart below), the S&P 500 (see chart below) and the small-cap Russell 2000 (see chart below) all appear to have “double topped” and have retreated to support lines. Without question growth concerns here in the United States are abound. These concerns escalated right after the release of May jobs report which was dismal to say the least. Couple these concerns with the potential of the United Kingdom leaving the European Union and its no wonder why the markets have pulled back over the past couple of weeks.

One of the risks to the markets that I highlighted in my last blog were interest rates. It appeared at the beginning of the month that the Federal Reserve and market pundits were all but certain that a rate hike would occur at today’s Federal Reserve meeting. Well thanks to the underwhelming May jobs report, no rate hike occurred this month and furthermore the Federal Reserve have lowered their outlook for any near term future increases! The Fed did say that they will be monitoring our economy and the data to guide them in their future policy decisions and sure enough they continue to stand by this protocol.

Now what? First for me, I want to see how the market reacts to next Thursday’s vote as to whether or not Britain leaves the European Union? Momentum does appear to be increasing for a British exit, which could lead to a global slowdown? Nobody knows if the referendum will pass or what type of effect this will have across the pond or here in the U.S. In the meantime, I will be monitoring the technical shape of our key indices and as you can see in the below charts each of these indexes have found support at either the 20-day, 50-day or 200-day moving averages.

Good luck to all 🙂

~George Mahfouz, Jr.

george mahfouz jr SPX chart

george mahfouz, jr Russell chart


george mahfouz jr Dow chart

george mahfouz jr nasdaq chart

Rate Hikes Are Looming…

Janet Yellen the chair of the Federal Reserve last Friday signaled that the Federal Reserve is prepared to raise interest rates in the coming months should the U.S. economy continue to improve. Some pundits suggest that a rate hike could come at the Fed’s next policy meeting in two weeks. Despite the rate hike chatter, the markets continue to shrug off what seemingly could be bearish for stocks. The Dow Jones Industrial Average (see chart below) is within striking distance of all time highs. Same can be said for the S&P 500 (see chart below), the Nasdaq (see chart below) finds itself flirting once again with the 5000 mark and the small-cap Russell 2000 (see chart below) appears to have caught a bid and is strengthening.

This type of market activity is counterintuitive when interest rates appear to be heading north. The flip side to this thinking is if the Federal Reserve is willing to raise rates due to a stronger economic back-drop, one can assume that this must be good for corporate America. Logically speaking I agree, however, if history has anything to do with the markets, a rising interest rate environment typically does not bode well for equities. Couple this with the seasonality of the summer months which tend to be weaker months for stocks and the upcoming fall presidential election, and I would say at the very least we will see a rise in volatility. These are very powerful forces that are lining up and I think it’s safe to say the markets will be very reactive to these events.

So what’s a trader or investor do in this landscape? For me personally I think the type of environment we are heading into creates opportunity on the long and short side. I will be paying close attention to overbought and oversold conditions of the markets and select equities throughout the summer and into the fall. As everyone knows by now my favorite technical indicator when it comes to spotting overbought/oversold conditions is the Relative Strength Index also known as the RSI. Many market technicians also favor this technical indicator when assessing market conditions from a technical standpoint. Over the years the RSI has demonstrated its usefulness and if you are not familiar with this technical indicator, you may want to research it out. Click here for starters.

Both Paula and I wish everyone a very safe, prosperous investing and trading summer 🙂

~George Mahfouz, Jr.

Screen Shot 2016-05-30 at 8.00.40 PMGeorge Mahfouz Jr. S&P 500 chartGeorge Mahfouz Jr. Nasdaq ChartGeorge Mahfouz Jr. Russell 2000 Chart


Retail Stocks Retreat!

So does this mean the consumer have closed their wallets? The SPDR S&P Retail ETF (Symbol: XRT) which has over 500M in net assets with holdings in a wide variety of the retail space has lost over 10 percent over the past few weeks with 4.4% of this sharp decline  occurring last Wednesday alone. This was the largest one day drop for this widely followed retail stock ETF in almost 5 years. Some individual retailers have even fared worst over the past month or so as their earnings reports and outlooks have been bleak to say the least. Just take a look of the charts of Macy’s (Symbol: M) and Nordstrom Inc(Symbol: JWN) and you can see just how much these retails missed their earnings numbers and well as how they guided for the upcoming quarter and second half of the year.

No question the retail sector sell-off had an effect on the overall markets with the Dow Jones Industrial Average (chart) closing down over one percent on the week, the Nasdaq (chart) finished lower by one half of one percent, the S&P 500 (chart) closed lower by the same margin and the small-cap Russell 2000 (chart) closed the week out down over one percent.

As mentioned in my previous blogthe technical shape of the aforementioned indices appear to be breaking down and this past week did not help at all. So now it’s not just the 20-day moving averages that have been breached, each of these indexes have all now broken through their respective 50-day moving averages. What’s more, is we do not find ourselves in an oversold condition according to the relative strength index also known as the RSI. So with no real market moving catalysts this upcoming week, it is possible that the current selling pressure continues until oversold conditions occur or other support levels are hit. Good luck to all.

~George

Volatility Wakes Up!

After weeks of tepid volatility (chart)  investors and markets appear a bit jittery with volatility waking up. For the week, the Dow Jones Industrial Average (chart) closed down 1.3%, the tech-focused Nasdaq (chart) closed off 2.7%, the S&P 500 (chart) closed lower by 1.3% and the small-cap Russell 2000 (chart) finished lower on the week by 1.4%. As first quarter earnings reporting season begins to wind down with overall results coming in mixed, we now enter a time of year where weakness in stocks can occur with volatility even more prevalent. The old adage “sell in May and go away” could come into play.

The currents risks to the market as I see it is the market itself as valuations are historically high with the S&P 500 price to earnings ratio trading in the 20’s. Another risk to stocks is the possibility of the Fed raising rates in June.  These catalysts alone could be all that it takes for equities to not only pause but to continue to experience increased volatility as we head into the summer months. So now let’s look at the technical shape of the aforementioned indexes. After trading near or in overbought territory for the past month or so the Dow Jones Industrial Average (chart) broke through its 20-day moving average, the S&P 500 (chart) also broke through its 20-day moving average, however, a bit more troublesome is the Nasdaq (chart)  as it has broke through its 200-day moving average this past week, a moving average that is more closely watched. Finally, the small-cap Russell 2000 (chart) is now sitting right at its 20-day and 200-day moving averages. So the technical shape of the markets at least according to moving averages support lines appear to be breaking down a bit.

So as we head into a typically softer time for equities that is May and June, and considering the current technical shape of the markets, both Paula and I feel it would be best to move to the sidelines and see if the current increase in volatility continues or if this is just a pause in the sharp rally we have seen since the middle of February.

Good luck to all 🙂

~George

Strong Week For Stocks!

The major averages continue to show strength upon the launch of first quarter earnings reporting season. The Dow Jones Industrial Average (chart) closed the week up 1.8%, the Nasdaq (chart) also closed up 1.8%, the S&P 500 (chart) added 1.6% and the small-cap Russell (chart) 2000 led the charge by closing the week up a whopping 3.1%. The money center banks such as JPMorgan Chase NYSE: JPM (chart), Bank of America NYSE: BAC (chart) and Citigroup NYSE: C (chart) which reported their earnings late in the week did help continue the momentum we have recently seen in the markets.

The question now is can earnings reporting season which begin in earnest next week breakout this market to new highs? Companies that are scheduled to report next week are International Business Machines Corp. NYSE: IBM (chart), Morgan Stanley NYSE: MS (chart), Netflix NasdaqGS: NFLX (chart), Goldman Sachs NYSE: GS (chart), Discover Financial Services NYSE: DFS (chart), Intel Corp. NasdaqGS: INTC (chart), Intuitive Surgical NasdaqGS: ISRG (chart), Johnson & Johnson NYSE: JNJ (chart), TD Ameritrade Holding Corp. NasdaqGS: AMTD (chart), Yahoo! Inc. NasdaqGS: YHOO (chart), American Express NYSE: AXP (chart), Coca-Cola NYSE: KO (chart), Qualcomm NasdaqGS: QCOM (chart), Biogen NasdaqGS: BIIB (chart), E*Trade Financial Corp. NasdaqGS: ETFC (chart), General Motors NYSE: GM (chart), Microsoft Corp. NasdaqGS: MSFT (chart), Southwest Airlines NYSE: LUV (chart), Starbucks NasdaqGS: SBUX (chart), Visa Inc. NYSE: V (chart), American Airlines Group NasdaqGS: AAL (chart), Caterpillar NYSE: CAT (chart) and General Electric NYSE: GE (chart) just to name a few.

Without question the aforementioned earnings reports will play a significant role in whether the key indices will breakout to new highs or struggle at their current resistance levels. One other historic factor that can play into the mix is April tends to be one of the top performing months of the year. Whatever the case is, I think it’s safe to assume a breakout or possibly a breakdown is on the horizon. Good luck to all 🙂

~George

First Quarter In The Books…

Q1 proved to be a mixed bag for the major averages. The Dow Jones Industrial Average (chart) closed out the first quarter up almost 1.5%, the S&P 500 (chart) finished up 0.77%, however, both the Nasdaq (chart) and the small-cap Russell 2000 (chart) finished out the first quarter of the year lower by 2.75% and 1.78% respectively. Not too shabby considering these key indices were down over 10% earlier in the quarter. This morning stocks are lower despite a stronger than expected  jobs report. In March, the economy added 215,000 jobs with the unemployment rate now at 5%.

With Q1 in the rear view mirror all attention will now be focused on first quarter earnings reporting season. The Commerce Department recently issued a report indicating that corporate profits were down 15% year-over-year. This does not bode well for stocks when the current p/e ratio’s of the major averages are well above their historic averages. With earnings reporting season just ahead, we will not have to wait too much longer to see how well corporate America is doing.

Let’s take a quick look at the technical shape of the markets. Most of the key indices are at or near overbought conditions, which has been the case for pretty much most of March. In my previous blog I eluded to what most market technicians look at when gauging overbought or oversold conditions. Furthermore and technically speaking, the major averages are all trading at or above their 20, 50 and 200-day moving averages with only the small-cap Russell 2000 (chart) chasing its 200-day. If you are bullish on the market, these moving average patterns are typically a good thing. That said, I do expect volatility to pick up a bit which is usually the case ahead of earnings reporting season. I will check back in mid-month or so to see how earnings growth actually appears.

Good luck to all 🙂

~George

Stocks Are Back!

Since losing over 10 percent of their values and going into correction territory earlier this year, the major averages now find themselves almost back to par. Year-to-date the Dow Jones Industrial Average (chart)  is only down around one percent, the S&P 500 (chart) is also lower by around one percent, the Nasdaq (chart) on the year has gained back over half of its losses and the small-cap Russell 2000 (chart) is lower by 4.5%. Since this bull market began over seven years ago, time and time again stocks have demonstrated astounding resilience. Seemingly every time there is a sell-off, willing buyers are ready to step in at varying support levels and buy up equities.

Today the Federal Reserve left interest rates unchanged and actually slashed their forecast to project only two additional rate hikes for the rest of this year versus the four rate hikes they had originally targeted. Stocks initially popped on the news and only one can conclude that the continuing accommodating monetary policies not only here in the United States, but from around the world is most likely the reason why this seven year bull market continues.

That said, the aforementioned indices are approaching overbought conditions according to the relative strength index. Remember the RSI is one of the favorite technical indicators by market technicians, certain algorithmic programs and institutional investors alike. The relative strength index measures and compares the size of moves in a selected period of time and according to the RSI, the 70 or greater value level signals an overbought condition and the 30 value level or lower indicates an oversold condition. Keep in mind stocks and/or indexes can remain overbought or for that matter oversold for an extended period of time. Currently the Dow Jones Industrial Average (chart) is almost touching the 70 value level and the other indexes are not too far behind. Of course this is only one of many technical indicators that traders and investors utilize, but I have found over the years the RSI is one of the more reliable indicators out there.

Good luck to all 🙂

~George