53 Record Highs And Counting…

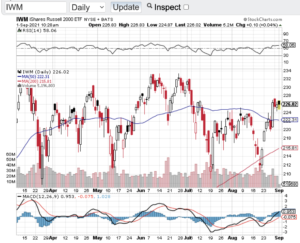
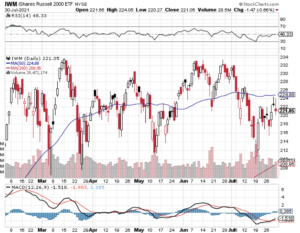
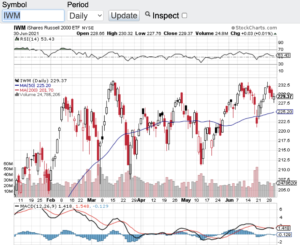
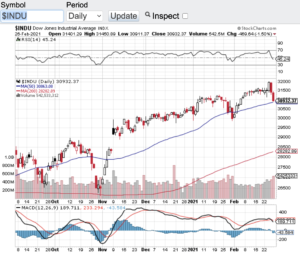
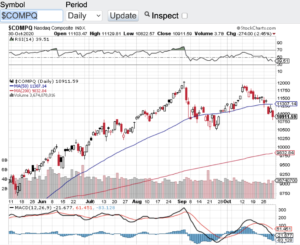
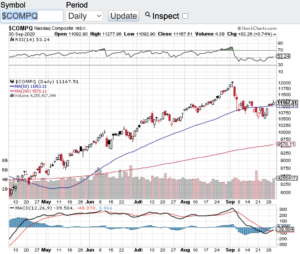
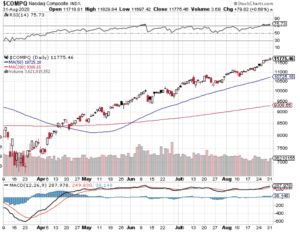
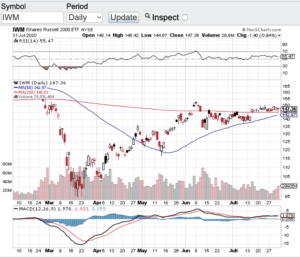
The S&P 500 (see chart here) has hit 53 record highs so far in 2021 and counting. That’s right folks 53 all-time highs this year alone. The Nasdaq Composite (see chart here) has logged 32 record highs in 2021 as well. The Dow Jones Industrial Average (see chart here) has also been on fire trading above the 35000 level and the small-cap Russell 2000 (see chart below) continues to perform alongside the aforementioned bellwether indexes. How much longer can this bull run? I think it began with the Federal Reserve and its longstanding monetary policies and now there seems to be a subtle change in the Fed’s position.

Last Friday at the Federal Reserve’s Jackson Hole Economic Symposium, Fed Reserve chairman Jerome Powell signaled again that the Fed would soon begin to pullback on its $120B per month bond asset purchases. This support to the markets and the economy along with a zero percent interest rate backdrop has been THE catalyst to support record high after record high in our stock market. Of course the massive economic stimulus packages that have been disseminated since the start of the pandemic has also played a role in consumer spending which has also propelled stocks to new heights.

Now we all know this cannot go on forever. Free money, zero percent interest rates, asset purchases and the like will end at some point in time. The question then becomes what happens to the stock market when all of this support winds down? Friends the answer is simple. Corporate America is going to have to produce on its own. Meaning this, for the continuation of this decade long bull market, companies will have to not only have to catch up with their current valuations they will have to exceed expectations going forward. This will certainly separate real growth companies from the rest of the pack and that’s when we just may see a more normal ebb and flow in our markets. Good luck to all 🙂 and have a safe and Happy Labor Day weekend.

~George

53 In a Row And Counting - Paula Mahfouz


Nowhere Near Raising Rates…

In the words of Fed Chairman Jerome Powell “the Fed is nowhere near considering raising rates”! Last Wednesday the Federal Reserve held its FOMC meeting where it kept interest rates essentially at zero. This despite inflation seemingly everywhere along with a strengthening economy. So, what gives? Without question the most recent spike in Covid cases across our country continues to keep the Fed at bay pertaining to rates. I do get the thinking and strategy; however, I am a bit concerned of inflation overheating and the continuation of record setting asset prices.

Last week three of the four major averages hit all-time record highs. The Dow Jones Industrial Average (see chart here) hit an all-time high of 35171. On Thursday the S&P 500 (see chart here) notched a record high of 4429 and the Nasdaq Composite (see chart here) booked a record high of 14863. The small-cap Russell 2000 (see chart below) is the one index that is lagging a bit but the uptrend there remains intact.

As mentioned above, I am a bit concerned as to the non-stop record setting ways with asset prices. There seems to be a growing concern on the street about the potential ramifications of easy monetary policies that have been in place for over a decade and counting. There is no question interest rates need to go up and the money printing needs to abate. Yes, we are in a once in a century pandemic and there has been no choice other than to flood the markets with stimulus and support. However, this cannot go on forever.

That said, as I look at the technical shape of the aforementioned key indexes, there are currently no problems there. Three of the four indices that just set records last week all remain above their respective 20-day, 100 and 200-day moving averages. Also, these indexes are not yet overbought according to the relative strength index aka the RSI. So, folks it appears the record setting ways of our markets should continue in the near term. Make sure to always consult with a certified financial advisor(s) before making any decisions and/or adjustments to your investment strategies.

Good luck to all 🙂

~George

Nowhere Near Raising Rates - Paula Mahfouz

No June Swoon This Year…

No June swoon this year, these markets are simply not having it. June historically can be either a slow month or a month of selling pressure. Neither really happened this year. Despite a brief dip in the major averages a couple of weeks back due to inflation concerns, stocks and indexes held their own last month. The Dow Jones Industrial Average (see chart here) closed out the month at 34502, the S&P 500 (see chart here) finished the month just shy of 4400, the Nasdaq Composite (see chart here) closed out the month in record territory at 14503 and the small-cap Russell 2000 (see chart below) finished the month and first half of the year at 2310.

I remain in awe of the resiliency of stocks and most every other asset class out there. I read the other day that Facebook (NasdaqGS: FB) has become the fifth company in the United States to surpass the $1 trillion value mark. We now have in our country five companies that are valued at over $1 trillion dollars. Apple (NasdaqGS: AAPL), Amazon (NasdaqGS: AMZN), Microsoft (NasdaqGS: MSFT) and Alphabet aka Google (NasdaqGS: GOOGL) round out the top five trillion-dollar companies. When I see this type of action it makes me wonder how much earnings power do these companies need to continue to exhibit in order to keep their eye-popping valuations going? One other obvious similarity is the companies are all tech stocks and that is where the real growth has been. If you go back 20 years, I don’t think anyone would of expected five companies in our markets all reaching and boasting trillion dollar plus valuations. Heck, Microsoft’s market cap just surpassed $2 trillion dollars to join Apple as the only companies with more than a $2 trillion dollar valuation. Folks I am not a forensic analyst, but my goodness how is the law of large numbers playing a role here?

As I look at the technical shape of the major averages nothing really stands out to me with the exception of the Nasdaq Composite (see chart here). The Nasdaq has just entered overbought territory according to the relative strength index aka the RSI. The Nasdaq also just hit an all-time high so I think some sort of pullback could potentially be in the offing.

Have a safe and happy 4th of July weekend 🙂

~George

No June Swoon This Year - Paula Mahfouz


Does It Feel A Bit Bubbly?

Do the markets feel a bit bubbly to you? This question is beginning to surface more frequently lately and I think it’s a great question to be asking. The majority of asset classes seemingly have gone straight up without pause over the past several months. Whether it’s the stock market as a whole, the crypto space or one of the hottest trends lately are SPAC’s. What is a SPAC? A SPAC is a special purpose acquisition vehicle that is publicly traded but has no assets other than cash. These vehicles are specifically designed to form as a public company, raise capital and then seek out companies to acquire. For example the electric vehicle space has been one of the favorite sectors for SPAC’s to target over the past year. This is a much easier pathway for private companies to go public without having to go through the time and expense of a traditional IPO.

One of the problems that is happening with the SPAC trade is once they identify a target and move to acquire it, the valuations of these SPAC’s begin to rise steadily into the nosebleed section of the markets. So much speculation is occurring with these SPAC’s institutional and retail investors are willing to pay essentially any price to get on board. Let’s not forget about the day traders that add fuel to the rise in these SPAC’s. So between all of the above and now with interest rates starting to tick up, it’s now wonder we have witnessed over a 1000 point drop in the Dow Jones Industrial Average (see chart here) to close out last week. Now let’s look at the technical shape of the major averages.

The Dow Jones Industrial Average (see chart below), the S&P 500 (see chart here), the Nasdaq Composite (see chart here) and the small-cap Russell 2000 (see chart here) over the past few trading sessions have all dropped below their respective 20-day moving averages and are finding support at their 50-day. Let’s see if these key indices can hold their 50-day moving average support zone this week. If they can the uptrend could very well remain intact, if not, we could see late last weeks selling pressure continue.

Good luck to all 🙂

~George

Does It Feel Bubbly? - Paula Mahfouz

Stocks Have Gone Wild!

Stocks have gone wild since the election with the Dow Jones Industrial Average (see chart here) breaking the 30000 level for the first time ever last week! This morning the S&P 500 (see chart here) hit its all time high trading above 3660. The Nasdaq Composite (see chart here) is also trading at its all time high and the small-cap Russell 2000 (see chart here) has also recently hit an all time high.

So why all of this love for stocks while we are in such a tumultuous time? I think it is safe to say that the Federal Reserve continues to play a major role in this never ending rally. Essentially zero percent interest rates, massive stimulus packages along with asset purchases remains the top catalysts for these record setting ways. The ironic part of disasters and catastrophes is the willingness and capabilities of central banks to step in to offset the negative economic impact of such catastrophes. COVID-19 has shocked the world and has lead to widespread unemployment, while devastating businesses and industries alike. Never before have we seen such widespread effects on life as we know it. The good news now is there is light at the end of the tunnel. The recent news on the advancements with vaccines and their effectiveness is very encouraging. Some pundits are now saying we could be at herd immunity by the summer of 2021. Let’s hope this is the case.

Now this is where things can get tricky for the markets. As the light at the end of the tunnel gets brighter, what happens when the Federal Reserve begins to change its stance on accommodative policies? The Fed backstop will not last forever. The risk here is that when the Federal Reserve signals a change in direction, it is then that the markets will become more tethered to actual corporate earnings power. So if you stay long this market or if you are adding on new positions, it would be a good idea to make sure you are invested in companies and sectors that have earnings power and continuing growth prospects.

Good luck to all 🙂

~George

Two Days To Go…

It’s two days to go before our country’s Presidential election takes place. I think most everyone now is exhausted by the process. How many more commercials can be displayed? How many more rallies can we take? What’s more is I think we have all had enough of the bashing and trashing that is going on and quite honestly this type of behavior is unbecoming of our great nation. Thank goodness this is almost over.

What has impressed me the most is how the markets have held up especially with all that is going on in our country. Yes, over the past couple of weeks the major averages have had a noticeable pullback. However, with the election at the forefront of everyone’s minds and the pandemic reaching all time highs, I have to ask myself why haven’t we seen a 20% or more correction? Instead we find ourselves in the midst of a 7-8% pullback. One of the answers very well may be how the averages are responding to their key technical support levels. Let’s first look at the Dow Jones Industrial Average (see chart here). On Friday, the Dow Jones on a intraday basis temporarily breached its 200-day moving average which is at the 26263 level. Then this bellwether average bounced sharply off of its support to close at 26501. Time and time again we have seen how important key support levels are to the markets and this was text book action pertaining to support levels at work. Friday was the perfect intraday response in how the Dow Jones Industrial Average responded to its 200-day moving average.

Now let’s take a look at the Nasdaq Composite (see chart below). On Friday, the Nasdaq essentially closed right at its 100-day moving average. So we will see this week whether or not this particular support line holds true to form. There are instances to where I have seen support levels breached for a few days or so and then respond. Whatever the case is, I am impressed with how the overall markets have weathered the backdrop of the current environment we find ourselves in.

Good luck to all 🙂

~George

Two Days To Go - Paula Mahfouz


Stimulus Package Chatter Buoys Markets…

Yesterday, the lastest round of stimulus package chatter came out of Washington which helped buoy our markets. The Dow Jones Industrial Average (see chart here) closed the month of September out at 27781, the S&P 500 (see chart here) finished the month at 3363, the Nasdaq Composite (see chart below) closed at 11167 and the small-cap Russell 2000 (see chart here) finished at 1507. Although stocks had a strong close to end September, the month of September was a net negative for the markets. No question the uptick in COVID both here and abroad has put some pause to this bull market rally. Quite honestly, I think stocks have held up pretty well despite the ongoing pandemic and the constant tape bombs coming out of Washington.

Fast forward to today and we are now a month away from our Presidential election. I have got to believe that we are heading into more volatility than what we experienced in September. I think whoever watched the first Presidential debate would agree. In addition to the upcoming election, we are also heading right into Q3 earnings reporting season. Corporate America will be releasing their third quarter financial results over the next 45 days or so and that alone can create higher volatility. I am not sure what to expect when companies report their numbers and even more so how companies provide their forward looking guidance on their conference calls. Whatever the case is, I think it’s fair to say we will not be trading sideways here in the month of October.

Let’s take a gander at the technical shape of the aforementioned indexes. What has impressed me lately is how the Dow Jones Industrial Average (see chart here) found support near its 200-day moving average and more recently its 50-day moving average. The same can be said for the other major averages in how they too have found support at their respective moving averages. What’s more is these key indices are no where near overbought territory according to the relative strength index aka the RSI. So from a technical analysis standpoint, the markets look to be on solid footing.

Good luck to all 🙂

~George

Stimulus Package Chatter Buoy Markets - Paula Mahfouz

Are The Indexes Out Of Balance?

With how hot tech stocks have been lately, one has to ask are the key indexes out of balance? Let’s take a look. It is no secret tech stocks have been on fire, the Nasdaq Composite (see chart here) has been setting records weekly. Stocks like Tesla, Apple and Amazon continue to set all time highs. Price to earnings ratios aka the P/E ratio are also expanding to levels not seen since the tech bubble of the early 2000’s. I am not suggesting that tech as a whole is in a bubble, but there can be an argument that certain tech stocks are. I am not singling out Tesla at all, but what I am highlighting is the company’s eye-popping 1000 + P/E ratio. The price to earnings ratio is a metric for valuing a company that measures its current share price to its earnings per share. For example the S&P 500 typically trades in the 15-20 P/E range. Yes, a 15 to 20 P/E multiple is the historic price to earnings multiple that the S&P 500 trades at. So when you look at Tesla and see that this company’s P/E ratio is currently over 1000, it does bring pause and perspective into the mix.

Back to the indexes that appear to be out of balance. As the S&P 500 (see chart here) and the Nasdaq Composite (see chart below) continue to set records, the majority of stocks have not returned to their pre COVID highs and still remain down on the year. This to me is something to pay attention to. Sure, some tech stocks deserve their current valuations due to how they are growing and benefiting from the widespread lockdowns. Tech stocks and the technologies they provide are serving businesses and consumers alike in a way no one would of thought of before the pandemic took hold of our country. However, even stocks like Apple have high seen quite the expansion of its P/E multiple which is currently trading at 39. Bottom line for me, as we are setting records each week, I would prefer to see a broader base rally to ensure that we are not out of balance with each and every record that is being set.

Good luck to all 🙂

~George

Are The Indexes Out Of Balance? - Paula Mahfouz


Big Tech Blowout!

Big tech steals the show with blowout earnings results. Apple (NasdaqGS: AAPL), Amazon (NasdaqGS: AMZN) and Facebook (NasdaqGS: FB) all took the street by surprise with their upside earnings reports. For Apple, in addition to their blowout earnings, the company announced a 4-1stock split. This was more than enough for Apple to close up over 10% yesterday at an all time high of $425.04. Apple’s earnings came in over $2.00 per share on revenues just shy of $60 billion. Stunning numbers considering the backdrop that our country is currently in. When I look at what Amazon did, I am equally if not more impressed especially with how they grew their revenues. It’s hard to believe a company of this size grew their revenues 40% to almost $90 billion on the quarter. Without question Amazon has benefited more than any other company due to the pandemic. Consumers have flocked to online shopping more now than ever. Last but not least, let’s look at what Facebook did. Despite experiencing ad boycotts by some of the biggest brands in the world, Facebook managed to grow ad revenues by over 10% and grew earnings by almost 100%. I don’t think anyone expected these type of quarterly results from this group with all things considered.

Let’s take a gander at the major averages and how they are looking from a technical standpoint. The Dow Jones Industrial Average (see chart here) closed the week at 26428.32. When I look at the chart of the Dow, this index is not overbought according to the (RSI) and the Dow closed right around its 20-day and 200-day moving averages. The S&P 500 (see chart here) closed at 3271.12 and this index bounced off of its 20-day moving average with perfection. The Nasdaq Composite (see chart here) has been the big winner so far this year and technically speaking this index could potentially keep running. Heck, i’d be ok if it paused and consolidated a bit because of the run its been on. The other index that I keep an eye on is the small-cap Russell 2000 (see chart below). Speaking of consolidation, that is what appears to be happening with the Russell 2000. This index has been trading sideways for the past week or so and is trading consistently above its 20 and 200-day moving averages during this consolidation period. So all in all the aforementioned indexes appear to be on solid ground from a technical analysis standpoint.

In closing, despite the current shape of the market, the month of August historically tends to be a volatile month. Couple this with the upcoming Presidential election and we could be in for a wild ride between now and election day.

Good luck to all 🙂

~George

Big Tech Blowout - Paula Mahfouz

The Best Quarter For The Major Averages In Decades!

We just witnessed the best quarter in the major averages in decades. Yes folks it is hard to believe that stocks are performing the in way that they are with all things considered. The Dow Jones Industrial Average (see chart here) is trading near the 26,000 level, the S&P 500 (see chart here) is trading this morning at the 3,120 level, the Nasdaq Composite (see chart here) is back over the 10,000 mark and the small-cap Russell 2000 (see chart here) is trading in the 1,450 zone.

The strength of stocks in general is one for the ages. I don’t think anyone would of thought that the markets would continue to show this type of resilience especially with the backdrop of our current unemployment picture and with Covid continuing to run rampant. The only logical reason as to why the Dow Jones Industrial average is not sub 20,000, has to be the continuing liquidity that is coming into the markets provided by Federal Reserve and the government stimulus packages that have launched since the crisis began. Of course there are select tech and pharmaceutical companies that are directly benefiting from the new world we find ourselves but I didn’t expect to see such a wide swath of stocks doing well in this current environment.

Now that the 3rd quarter of the year has begun I think all eyes will begin to focus on second quarter earnings results which kicks off next week. What’s even more important in my eyes is the energy, spirit and guidance that comes out of companies during their earnings conference calls. I am expecting companies to either pull their future guidance or lower earnings expectations, we shall see. Another catalyst that I expect to play a role in how the markets will fare here in Q3 is how the Presidential polls continue to unfold. Currently Joe Biden has a double digit lead over Donald Trump. Some pundits are saying that the markets are beginning to price in a Biden win. Candidate Biden has already stated that he will raise the capital gains and corporate taxes should he become President. If this is the case, higher taxes would negatively affect net earnings but this scenario could be offset by other positive geo-political factors should Biden win.

Good luck to all 🙂

~George