All Time High For The Dow!

Yet another all-time high was set for the Dow Jones Industrial Average! (see chart here and below). Stocks continuing their winning ways especially for the Dow Jones Industrial Average which closed out the month of August at 41,563 setting a fresh record high. The S&P 500 (see chart here) is flirting with a new high as well, however, both the Nasdaq Composite (see chart here) and the small-cap Russell 2000 (see chart here) are playing catch up.

For some the stock market performance here in 2024 is a head scratcher. Pundits are asking why is the stock market continuing to outperform despite the headwinds our country faces? The immediate knee jerk response to that question is seemingly easy to answer; inflation is cooling, and the Federal Reserve is signaling rate cuts. I am not so sure it is that easy of an answer. Sure, inflation is indeed adjusting down and the Fed seems to be ready to cut rates, however, I would also have to add in that the calendar is also playing a role. Historically, election years tend to positive years for stocks, this along with the Fed seemingly ready to cut rates is a set-up for market outperformance, hence all-time highs have been plentiful throughout this calendar year. That being said, I would not be surprised to see volatility pick right back up as we head into September. Historically, September is a tough month for stocks, (click here). Pundits call it the September effect which basically is an historical average over the past 100 years on how the market performs in the month of September and that metric demonstrates a consistent downward trend in this given month. Now past performance does not guarantee future results, but this is something I will pay attention to.

Whatever the case is, we are now heading straight into year end with a Presidential Election to boot. I do expect a lot of action and volatility straight ahead. Good luck to all 🙂

~George


Stocks Have Gone Wild!

Stocks have gone wild since the election with the Dow Jones Industrial Average (see chart here) breaking the 30000 level for the first time ever last week! This morning the S&P 500 (see chart here) hit its all time high trading above 3660. The Nasdaq Composite (see chart here) is also trading at its all time high and the small-cap Russell 2000 (see chart here) has also recently hit an all time high.

So why all of this love for stocks while we are in such a tumultuous time? I think it is safe to say that the Federal Reserve continues to play a major role in this never ending rally. Essentially zero percent interest rates, massive stimulus packages along with asset purchases remains the top catalysts for these record setting ways. The ironic part of disasters and catastrophes is the willingness and capabilities of central banks to step in to offset the negative economic impact of such catastrophes. COVID-19 has shocked the world and has lead to widespread unemployment, while devastating businesses and industries alike. Never before have we seen such widespread effects on life as we know it. The good news now is there is light at the end of the tunnel. The recent news on the advancements with vaccines and their effectiveness is very encouraging. Some pundits are now saying we could be at herd immunity by the summer of 2021. Let’s hope this is the case.

Now this is where things can get tricky for the markets. As the light at the end of the tunnel gets brighter, what happens when the Federal Reserve begins to change its stance on accommodative policies? The Fed backstop will not last forever. The risk here is that when the Federal Reserve signals a change in direction, it is then that the markets will become more tethered to actual corporate earnings power. So if you stay long this market or if you are adding on new positions, it would be a good idea to make sure you are invested in companies and sectors that have earnings power and continuing growth prospects.

Good luck to all 🙂

~George
Tesla Follows SpaceX…

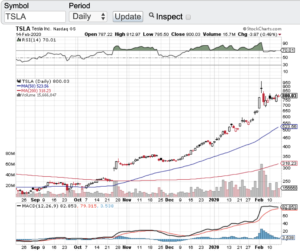
Tesla follows SpaceX right into space! Tesla’s stock that is! (Nasdaq:TSLA). I am not sure if even Elon Musk thought that Tesla’s stock price would almost hit $1000 per share (see chart below) before its fundamentals warrant it. That’s right folks on February 4th Tesla hit an all-time high of $968.99 with an astounding parabolic move. This kind of stock behavior reminds me of the dot-com days where companies were trading in nose bleed territory without the fundamental backdrop to support the valuation. That said, without question the extremely large short position that has been put on Tesla has played a major role in the stock price spike. Tesla has long been one of the most shorted stocks on the Nasdaq which when stocks breakout of a trading range such as what happened to Tesla, and also having a significant short interest against it, then it’s the perfect set up for a major parabolic move.

With the stock still trading north of $800 per share, the company is not missing out on their next financing. To close the week out, Telsa took advantage of their recent stock price surge to price a $2 Billion secondary offering at $767 per share. I mean brilliant move for a company that continues to experience sporadic growth and still demands cash in order to hit their objectives. The potential problem I see is how can the Tesla a stock hold up at this crazy valuation? No question the short sellers covering their positions was a big part of this recent parabolic move. So the question now is who and what will drive the price higher? What’s more is who and what is going to support a $150 Billion dollar valuation? There are some analysts that are on their soapboxes with new buy recommendations and new target prices in the $1,000’s. So just maybe this will be enough to keep the stock up until the company catches up to its current valuation.

Good luck to all 🙂

~George

Tesla Follows SpaceX - Paula Mahfouz


Strong Economy Equals A Strong Stock Market!

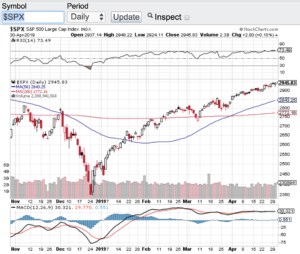
The economy posted a 3.2% gain in the first quarter and as the saying goes, a strong economy equals a strong stock market! Is it any wonder as to why the Nasdaq Composite (see chart here) hit an all-time high on Monday! The same rings true with the S&P 500 (see chart below). The S&P 500 hit an all-time high on Monday as well. Now the Dow Jones Industrial Average (see chart here) has a bit more work to do in order to tap its own record as does the small-cap Russell 2000 (see chart here). However, I am sure the bulls will take 2 out of the 4 major averages setting all time highs. What is also helping the stock market is how the Federal Reserve has taken a cautious approach to raising rates any further. In fact, there are calls out of Washington DC asking the Fed to start lowering rates to stimulate the economy even further. Now I am not so sure that the Fed will accommodate Washington’s request, but I do think it is safe to say that we should not see a rate hike in the near future or maybe not at all for the rest of this year.

One note of caution to me is that with nearly half of corporate America reporting their Q1 earnings so far, we are seeing on average a year over year decline in earnings. There are still 100’s of companies set to report over the coming weeks but if this trend continues, this will be the first year over year decline in corporate earnings in years. I will be keeping an eye on this development.

The technical shape of the aforementioned indexes remain intact. The Dow, Nasdaq, S&P 500 and the Russell 2000 all are trading above their respective key moving averages. However, both the Nasdaq Composite (see chart here) and the S&P 500 (see chart here) have entered into overbought territory according to the relative strength index also know as the RSI. That said, I would not be surprised to see at the very least some consolidation or an outright healthy pullback. Good luck to all 🙂

~George

S&P 500 - Paula Mahfouz

Bellwether Indexes Surge To All Time Highs!

Bellwether indexes surge to all time highs as the S&P 500 (chart) closed the month of August at 2901, the Nasdaq Composite (chart) closed at 8109, the small-cap Russell 2000 (chart) closed at 1740 and the Dow Jones Industrial Average (chart) is within striking distance of its all time high. I thought August is supposed to be a tough month for stocks? Not this year! New highs are happening while the political environment in our country is at a seemingly all-time low, the word impeachment surfaces daily now, tariffs are in the headlines daily, interest rates have been on the rise and now it seems that any type of progress made over the summer with North Korea may be in jeopardy. One would think that the aforementioned risks would be enough for an outright 10-20 percent market correction. Add in the seasonality factor and we should indeed be going red, not making all-time highs.

Now I am afraid to even mention that the month of September is historically the weakest month of the year for stocks right alongside with August. Do I dare say that September will be the month that our markets correct in a meaningful way? Do I have the courage to predict that this will be the month where the markets recognize and adjust for all of the risks that are present in our current environment? I don’t know people, I am as baffled as the next guy as to how these markets keep shrugging off real market issues. Oh by the way I forgot to mention we have mid-term elections forthcoming, the markets are not pricing in any risk there either. These markets are priced and acting like there is no absolute risks at all out there. Ok enough banter already!

How to play the markets now? I am a fan of the old adage “the trend is your friend” but folks I just can’t hop on this train at this point in time. I am heading to the sidelines until I see any type of technical breakdown to possibly consider implementing a short thesis or just wait for the inevitable pullback/sell-off to identify any potential long set-ups. Until then, Paula and I wish everyone a very safe and Happy Labor Day weekend 🙂

~George