Nowhere Near Raising Rates…

In the words of Fed Chairman Jerome Powell “the Fed is nowhere near considering raising rates”! Last Wednesday the Federal Reserve held its FOMC meeting where it kept interest rates essentially at zero. This despite inflation seemingly everywhere along with a strengthening economy. So, what gives? Without question the most recent spike in Covid cases across our country continues to keep the Fed at bay pertaining to rates. I do get the thinking and strategy; however, I am a bit concerned of inflation overheating and the continuation of record setting asset prices.

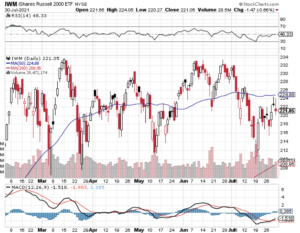
Last week three of the four major averages hit all-time record highs. The Dow Jones Industrial Average (see chart here) hit an all-time high of 35171. On Thursday the S&P 500 (see chart here) notched a record high of 4429 and the Nasdaq Composite (see chart here) booked a record high of 14863. The small-cap Russell 2000 (see chart below) is the one index that is lagging a bit but the uptrend there remains intact.

As mentioned above, I am a bit concerned as to the non-stop record setting ways with asset prices. There seems to be a growing concern on the street about the potential ramifications of easy monetary policies that have been in place for over a decade and counting. There is no question interest rates need to go up and the money printing needs to abate. Yes, we are in a once in a century pandemic and there has been no choice other than to flood the markets with stimulus and support. However, this cannot go on forever.

That said, as I look at the technical shape of the aforementioned key indexes, there are currently no problems there. Three of the four indices that just set records last week all remain above their respective 20-day, 100 and 200-day moving averages. Also, these indexes are not yet overbought according to the relative strength index aka the RSI. So, folks it appears the record setting ways of our markets should continue in the near term. Make sure to always consult with a certified financial advisor(s) before making any decisions and/or adjustments to your investment strategies.

Good luck to all šŸ™‚

~George

Nowhere Near Raising Rates - Paula Mahfouz

Super week for stocks!

Stocks rallied for the second straight week as the key indicesĀ have now just about recaptured all of their losses incurred in August. The Dow Jones Industrial Average (chart) had one of its best weekly showings of the year gaining over 3%, the Nasdaq (chart) closed the week up 1.7%, the S&P 500 (chart) +1.98% and the small-cap Russell 2000 (chart) finished the week up 2.37%. Over the past couple of years, time and time again whenever equities as a whole have had a five percent pullback or so, such as what we experienced in August, a significant rally ensues and the bull market seemingly resumes. They say markets are forward looking indicators, well we must be in store for quite the year-end closeout, or are we?

This upcoming week the FOMC meeting will take center stage. The debate is on as to whether or not the Fed will start reducing its bond and mortgage back securities purchasesĀ and what effect this could have on the markets. My feelings are that there is still enough tepid economic data coming in for the Fed not to begin to taper. However, there are plenty of pundits out there that argue that the economy is beginning to show pockets of strength which could give the Fed the green light to begin with a small reduction with their future purchases. Either way, the technicals are now on their way to overbought territory, and interest rates are continuing to rise with the 10-year treasury noteĀ (chart) closing in on 3%.Ā This could be a one-two punch to once again slow down and even potentially reverse this most recent rally.

That said, if you are a technical trader, this is an almost perfect environment to trade in. Support levels are continuing to be honored as well as resistance marks. We now find ourselves butting up against the upper end of the trading range in the S&P 500 (chart) and we could very well be headed back to support levels which in this case would be the 1630 zone on the S&P (chart). If the markets embrace the Fed’s action or lack thereof, a breakout above the all time high of 1709 of this key index could very well be in the cards.

Good luck to all and have a great week šŸ™‚

~George


Technically speaking…

Stocks finished lower for the week as volatility continued to rise. For the week, the Ā Dow Jones Industrial Average (chart) closed down 1.17%, the Nasdaq (chart) -1.32%, the S&P 500 (chart) -1.01% and the small-cap Russell 2000 (chart) closed the week lower by 0.63%.Ā Is this bull market beginning to show signs of fatigue or is this just a typical pre-summer pullback? Let’s take a look at the technical picture of these key indices and see what’s going on there.

Market technicians use a multitude of indicators to discern potential support or resistance levels. My preference has always been to keep things as simple as possible when analyzing charts of stocks or indices. The two indicators I pay the closet attention to is the Relative Strength Index also know as the RSI and the moving averages. Out of dozens of technical indicators that are available, you may ask why do I prefer these particular indicators? The answer simply is that high profile market technicians, Ā computerized trading models and certain institutional investors utilize them. Ā Time and time again when I see that Relative Strength Index (RSI) is indicating an overbought or oversold condition, the majority of the time the asset or index reverts to the mean. Same rings true with the moving averages, whenever a stock or index bumps up against or comes down to its moving average, typically the stock or index finds support or resistance.

Let’s break this down in more detail. Pertaining to the (RSI),Ā TheĀ RSIĀ is designed to demonstrate whether or not an index or equity is overbought or oversold, depending on certain value levels. According to theĀ RSIĀ principle, the 70 value level or greater, is an overbought condition and the 30 value and below is an oversold condition. As of right now the aforementioned indices are hovering around the 50 value level which is not indicating an extreme condition either way. Looking at the moving averages these indices remain above their 50-day moving average and as you can see with the Dow Jones Industrial Average (chart)Ā and S&P 500 (chart), these indexes have bounced off their 50-day moving averages/support lines three times over the past week or so which clearly demonstrates the potential of the power and precision of this particular technical indicator.

So technically speaking, I see nothing that would indicate an extreme condition of these indexes and as long as their are no major surprises out of the FOMC meeting next week, we should see smooth sailing heading into the summer. Good luck to all.

Have a great weekend šŸ™‚

~George