The market environment we find ourselves in is a clear dynamic of the Federal Reserve taking on inflation. The question now is will the Federal Reserve overreach with its interest rate war on inflation? One thing I have learned as it pertains to the markets is not to go against the power of the Fed and to trust they will ultimately steer the ship right.
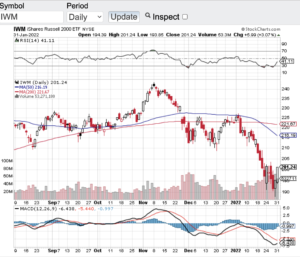
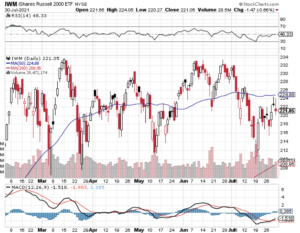
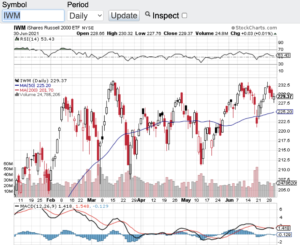
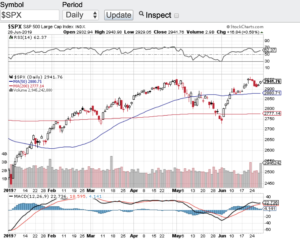
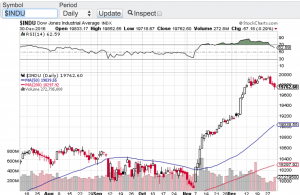
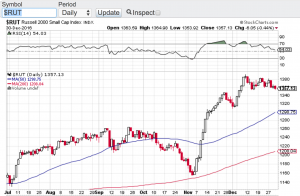
That being said, what a month to forget for stocks! In the month of September alone the Dow Jones Industrial Average (see chart here) lost almost 9%, the S&P 500 (see chart here) fell over 9% while the Nasdaq Composite (see chart here) and the small-cap Russell 2000 (see chart here) both gave up over 10% in September. I think we are all ready to turn the page on the markets summer performance. In fact, the year to date performance of the major averages are well into bear market territory.
In hindsight it was plain as day how unsustainable asset prices were across the board. From the stock market to the real estate market to the crazy land of cryptos. The excesses that the markets enjoyed while they were hot was a direct reflection of the Fed’s easy monetary policies. From essentially zero percent interest rates, to buying up treasuries and other asset classes to keep the economy strong during Covid, now the markets are paying that price. The head scratcher for me is how long it took the Fed to reverse its course but at least now we can begin to get to normalized rates which is a net positive for all markets.
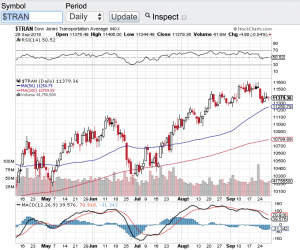
As I look at the current technical shape of the aforementioned indexes, it’s not a pretty sight. The Dow Jones Industrial Average (see chart here), the S&P 500 (see chart here) and the Nasdaq Composite (see chart here) are at or below their 52-week lows with no technical support yet in sight. The small-cap Russell 2000 (see chart here) is near its 52-week low but does have a bit of support right here. I think we could continue to see some more selling pressure before it’s all said and done but if you are a long-term holder of equities these type of market conditions can create some great opportunities too.
Good luck to all 🙂
~George