The Best Quarter For The Major Averages In Decades!
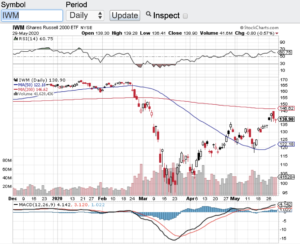
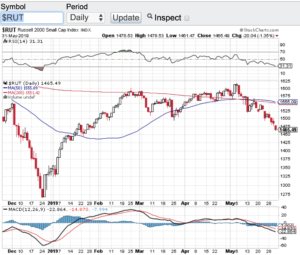
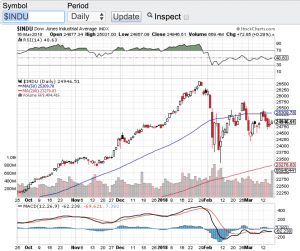
We just witnessed the best quarter in the major averages in decades. Yes folks it is hard to believe that stocks are performing the in way that they are with all things considered. The Dow Jones Industrial Average (see chart here) is trading near the 26,000 level, the S&P 500 (see chart here) is trading this morning at the 3,120 level, the Nasdaq Composite (see chart here) is back over the 10,000 mark and the small-cap Russell 2000 (see chart here) is trading in the 1,450 zone.
The strength of stocks in general is one for the ages. I don’t think anyone would of thought that the markets would continue to show this type of resilience especially with the backdrop of our current unemployment picture and with Covid continuing to run rampant. The only logical reason as to why the Dow Jones Industrial average is not sub 20,000, has to be the continuing liquidity that is coming into the markets provided by Federal Reserve and the government stimulus packages that have launched since the crisis began. Of course there are select tech and pharmaceutical companies that are directly benefiting from the new world we find ourselves but I didn’t expect to see such a wide swath of stocks doing well in this current environment.
Now that the 3rd quarter of the year has begun I think all eyes will begin to focus on second quarter earnings results which kicks off next week. What’s even more important in my eyes is the energy, spirit and guidance that comes out of companies during their earnings conference calls. I am expecting companies to either pull their future guidance or lower earnings expectations, we shall see. Another catalyst that I expect to play a role in how the markets will fare here in Q3 is how the Presidential polls continue to unfold. Currently Joe Biden has a double digit lead over Donald Trump. Some pundits are saying that the markets are beginning to price in a Biden win. Candidate Biden has already stated that he will raise the capital gains and corporate taxes should he become President. If this is the case, higher taxes would negatively affect net earnings but this scenario could be offset by other positive geo-political factors should Biden win.
Good luck to all 🙂
~George