The New Norm…

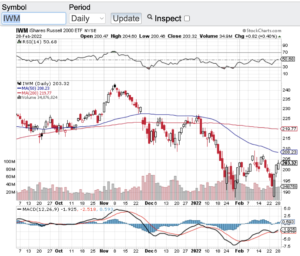
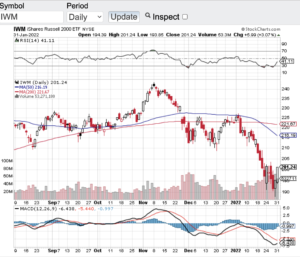
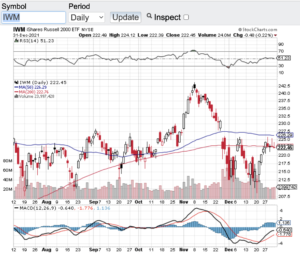
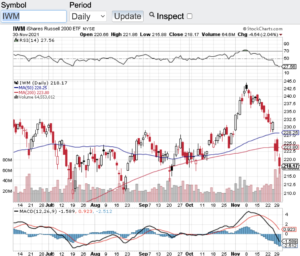
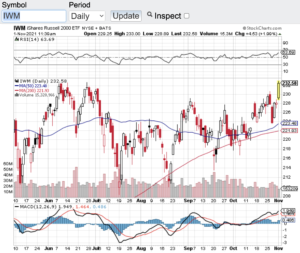
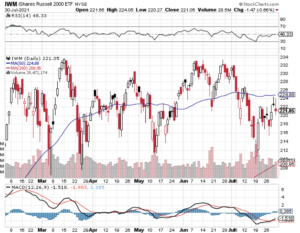
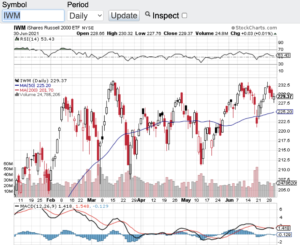
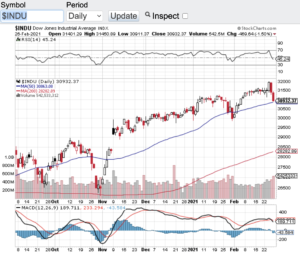
I think it is becoming safe to say that we are now in the new norm! The stock market for over a decade has feasted on the Federal Reserve’s accommodative policies and most recently the stimulus provided by governments from around the world during the pandemic. Under normal market conditions, stocks trade on their own merits and prospects. This has simply not been the case in years. Fast forward to today and we now have a Federal Reserve raising interest rates, reducing their own stimulus programs to stave off inflation and get back to more normalized Fed policies and procedures. Now the markets are taking notice. Volatility in the markets continue as has been the case for months now. Year to date, the Dow Jones Industrial Average (see chart here) is down 10 percent, the S&P 500 (see chart here) is lower by 15%, the Nasdaq Composite (see chart here) on the year is down almost 25% and the small-cap Russell 2000 (see chart here) is down about 18%.

Yes, I believe we have entered a new norm. Which isn’t necessarily a bad thing from the standpoint of properly evaluating companies. What’s been very difficult during the past decade or so is how to evaluate public companies. The Federal Reserve and its unprecedented accommodative monetary policies was a huge driver of how companies were valued. Meaning this, when there are hardly any choices of attaining yield whether it is from stocks or bonds, this forces capital into the stock market or other higher risk assets. This has been one of the primary drivers of the incessant bull market investors have enjoyed over the years. Now, companies are going to have to perform to maintain their position in the marketplace. The ones that do, will be rewarded, the ones that don’t will experience adjustments in their valuations.

With all the above being said, I am confident that once the stock market bottoms out, there will be great opportunities to consider and act on. Good luck to all 🙂

~George

Technically Speaking…

The sell-off in the markets accelerated in the month of April and technically speaking it appears there could be more selling pressure ahead. On the year, the Dow Jones Industrial Average (see chart here) is down nearly 10 percent, the S&P 500 (see chart here) is off over 13%, the Nasdaq Composite (see chart here) is down over 21% and the small-cap Russell 2000 (see chart here ) year to date is down 17%.

I am not surprised of the market weakness due to all the factors at play right now. From the war in Ukraine, to the highest inflation rates we have seen in over 40 years, the ongoing Covid backdrop albeit this dynamic appears to be improving and finally, interest rates. The Federal Reserve now has woken up to the fact that this low interest rate environment that we have lived in for over a decade is over. Runaway inflation has now become a major concern for the Fed, and they are now being beyond vocal of their intentions. A 50-basis point increase appears to be the hike here in May and hikes throughout the year are in play. In my view, this is the top catalyst as to the sell-off but let’s keep things in perspective. Last year and previous years for that matter have been a boon for stocks and pretty much every other asset class out there. Record after record have been set for years on asset classes and this is simply not sustainable. A healthy correction is beyond needed and it seems like we are in that mode now!

Now let’s look at the technical shape of the aforementioned key indexes. The Dow Jones Industrial Average (see chart here), the S&P 500 (see chart here), the Nasdaq Composite (see chart here) and the Russell 2000 (see chart here) all closed the month of April out below their key moving averages. The 20-day, 50-day, 100 and 200-day have all been breached while the Relative Strength Index aka the RSI have not yet breached an “oversold” condition. The RSI is a technical “momentum indicator” that has two values of importance. The 70-value level for potential “overbought” conditions and the 30-value level and below is a level that is considered “oversold. All the above indexes are currently hovering around the 35 level. Please remember “technical indicators” are there as a guide and a tool when assessing the technical backdrop of any given stock or index and is not 100 percent perfect.

Good luck to all 🙂

~George


Volatility Hits The Markets…

Volatility has hit the markets to the point that the VIX (see chart here) aka the fear gage has broken out. Stocks have been on a tear as of late but unfortunately to the downside. No one is surprised that the markets have become extremely volatile due to the Russian invasion of Ukraine. The Dow Jones Industrial Average (see chart here) fell over 10% since the crisis began as has the S&P 500 (see chart here). Both the Nasdaq Composite (see chart here) and the small-cap Russell 2000 (see chart here and below) have sold off closer to 15% before bouncing off of their sell-off lows. Again, no surprise that vol has spiked to almost a double over the past few weeks as tensions increased.

Before we get into the technical shape of the markets it’s hard for me to even talk stocks and indexes due to the atrocities happening abroad. Our prayers go out to everyone in the Ukraine that is being affected by this invasion and for the people of Russia who wants no part of this. Hopefully very soon a cease fire will happen and happen for good!

Now let’s look at the technical set-up that has occurred since the buildup and invasion with the aforementioned key indexes. Starting with the Dow Jones Industrial Average (see chart here). The Dow a few days ago hit a low of 32272 and has bounced to the 34,000 zone. There is much more work here to be done before the Dow can recapture its 100 and 200-day moving averages. The same can be said for the S&P 500 (see chart here) although with the S&P, it is closer to its 20-day M/A than the Dow Jones Industrials Average. Interestingly both the Nasdaq Composite (see chart here) and the small-cap Russell 2000 (see chart here) have bounced off of their recent lows stronger with the Russell 2000 recapturing its 20-day M/A. Despite the recent bounces off of their sell-off lows I think it is fair to say that we are not out of the woods yet in the volatility we have seen as of late. If you are a long-term investor, this will pass at some point in time. For experienced traders this is an environment where money can be made both on the long and short side of the markets. That said, I always recommend consulting your certified professional financial advisor(s) before making any moves in the backdrop we currently find ourselves.

Good luck to all 🙂

~George

Volatility Hits The Markets - Paula Mahfouz

The 200-Day Recaptured!

On the last trading day of January, both the Dow Jones Industrial Average (see chart here) and the S&P 500 (see chart here) recaptured and closed above their 200-day moving averages. Why is this important to note? The 200-day moving average of any index or stock for historically acts as significant support in an uptrend and in a downtrend can act resistance. Since the first half of the new year both of these indexes have sold off to the extent of breaching their 200-day moving averages. This can also be said for the Nasdaq Composite (see chart here) and the small-cap Russell 2000 (see chart here). What’s different right now amongst these key indexes is that the Nasdaq and Russell (see chart below) remain below their respective 200-day with some work to do. Let’s see if these two bellwethers can catch up to the Dow and S&P 500.

Headwinds do remain in the economy including inflation and now the backdrop of an upcoming rising interest rate environment. I think if the Federal Reserve manages their interest rate hikes in a methodical manner and communicates effectively to the street of their intentions, I don’t think the markets will be disrupted too much. Of course, geopolitical events such as the potential of Russia invading Ukraine and North Korea engaging once again in missile tests, these dynamics depending how they play out could impact the markets in the near term and the downtrend we witnessed last month could resume. Hopefully both geopolitical events turn out to be no more than a threat vs a reality.

Notwithstanding the above, I do see some hope with the pandemic numbers as of late. It does appear the spike in infections due to the omicron variant seem to have peaked which is great news for our country and the world for that matter. Hopefully soon there could be some semblance of normality which could be the catalyst for the recent downtrend in the markets to reverse its course as well.

Good luck to all 🙂

~George

The 200-Day Recaptured! - Paula Mahfouz


Record After Record!

The U.S. stock market notched record after record in 2021! What a year for all asset classes from stocks, to real estate, to the crypto markets!

The Dow Jones Industrial Average (see chart here) finished 2021 up 18.7%. The S&P 500 (see chart here) closed the year out up a whopping 27%. The Nasdaq Composite (see chart here) closed up 21.5% and the small-cap Russell 2000 (see chart here) closed 2021 up 13.7%. How counterintuitive are these results as our country and the world for that matter continues to face and deal with Covid-19. Covid is now entering its 3rd year with the latest variant taking the world by storm. The omicron variant are causing infection rates to soar. However, scientists are hopeful that this variant could be the catalyst to ending this pandemic due to how less virulent this variant is at least to the fully vaccinated. It’s still early but the way omicron has now seemingly and abruptly reversed its course in South Africa, there is hope that this will be the case everywhere else.

Back to the markets. As we enter 2022 the big question and maybe the only question the markets have is how aggressive will the Federal Reserve be in hiking interest rates. No question in the new year interest rates will begin to head north. Inflation is soaring and impacting almost everything, which is part of the reason why we are seeing all-time highs across the board. This is not sustainable and with interest rates on the verge of increasing, stocks will face their first true test as the tightening rolls out. That said and because the pandemic is still wreaking havoc, I do not expect the Fed will be too aggressive out of the gate.

Let’s look at the technical shape of the aforementioned indexes. The Dow Jones Industrial Average (see chart here) is comfortably trading above its 100 and 200-day moving averages as is the S&P 500 (see chart here) and the Nasdaq Composite (see chart here). The small-cap Russell 2000 (see chart below) is trading at it 100 and 200 day MA so let’s see if these support lines hold for the Russell. The other technical indicator that I prefer is the relative strength index aka the RSI and none of the aforementioned indexes are in overbought territory according to the RSI. The 70 value level of the RSI is considered overbought and the 30 value level is considered oversold and each index is trading right around the middle of that range.

Happy New Year!

~George

Record After Record! - Paula Mahfouz


New Variant Spooks Markets…

A new Covid variant has spooked the markets enough to spike the VIX almost 50% (see chart here). The VIX aka the fear index took off on Friday after news out of South Africa that a new variant has emerged. The CBOE volatility index is a measure of price action in the S&P 500 options chain over the next 30 days. Investors and institutional investors alike pay attention to how investor sentiment is going at any point in time through the CBOE vol index. Historically when the markets are at work with no real headwinds or threats, the VIX in the 10-15 value range. Yesterday the VIX closed north of 27. No question over the past few days the VIX is revealing a bit of investor anxiety.

So now the question becomes is this a short-lived dynamic or is there more selling pressure in the offing? My feelings are this is a normal knee jerk reaction to yet another potential obstacle our economy and markets face. From what I have read we are weeks away to understanding the severity of this new variant or lack thereof. In the meantime, I think patience is key and to not act in haste. For all we know the vaccines could protect the population from this latest variant and if so, the markets could snap right back. However, if this becomes as severe and contagious as the Delta variant, then there is a strong chance the markets would continue to adjust accordingly.

Let’s look at the technical backdrop of the major averages starting with the Dow Jones Industrial Average (see chart here). The Dow sold off over 650 points yesterday to close just above its 200-day moving average. The S&P 500 (see chart here) closed lower by 88 points approaching its 100-day moving average. The Nasdaq Composite (see chart here) closed the month of November down 245 points while breaching its 20-day moving average. Last but not least, the small-cap Russell 2000 (see chart below) closed down sharply as well yesterday, however, technically the Russell broke its 100 and 200-day moving averages in a meaningful way which does not bode well for this particular index as we enter the last month of the year.

One final note, no matter what happens in the market here in the short term, please take care of yourselves and your loved ones. We are approaching the two-year mark of this pandemic and everyone should take this serious, put the politics and conspiracy theories away and come together once and for all.

Wishing everyone a safe and healthy holiday season 🙂

~George

New Variant Spooks Markets - Paula Mahfouz

Strong Earnings – Record Highs!

Last month I asked “Is this a healthy correction or something more?” and based on how strong earnings have been along with record highs, I think it is fair to say last months action was more of a healthy pullback than anything else. The Dow Jones Industrial Average (see chart here) is at an all-time high trading above the 36000 mark, the S&P 500 (see chart here) has also hit an all time high today, the Nasdaq Composite (see chart here) has also joined the all-time high club and the small-cap Russell 2000 (see chart here) is within striking distance of its all-time high.

The most recent catalyst for stocks and indexes hitting their all-time highs are earnings. 80 percent of the companies on the S&P 500 that have reported their Q3 earnings so far have beat Wall Street expectations. There are still 1000’s of companies set to report over the coming weeks but if trend continues we could very well be seeing more records set. Along with a strong earnings reporting season no question the Fed continues to encourage all investors to participate due to how low interest rates remain. For most investors there are not many options right now to generate meaningful returns other than the stock market or the high flying crypto space which remains incredibly volatile and extremely risky.

Now let’s take a look at the technical backdrop of the aforementioned indexes. The Dow Jones Industrial Average (see chart here) is trading comfortably above its key moving averages and not quite overbought according to the relative strength index (RSI) and the same can be said for the S&P 500 (see chart here) and the Russell 2000 (see chart below). However, the Nasdaq Composite (see chart here) has just breached the 70 value level of the RSI which is the pure definition of a stock or index becoming overbought. Note, stocks and/or indexes can remain overbought for extended periods of time before a turn.

One of the oldest adages on Wall Street is the trend is your friend and it is clear where the trend has been and where it will most likely go. That said, it is always best to consult with your certified financial planner/advisor if you are considering any portfolio additions, deletions or adjustments.

Good luck to all 🙂

~George

Strong Earnings - Record Highs - Paula Mahfouz

Nowhere Near Raising Rates…

In the words of Fed Chairman Jerome Powell “the Fed is nowhere near considering raising rates”! Last Wednesday the Federal Reserve held its FOMC meeting where it kept interest rates essentially at zero. This despite inflation seemingly everywhere along with a strengthening economy. So, what gives? Without question the most recent spike in Covid cases across our country continues to keep the Fed at bay pertaining to rates. I do get the thinking and strategy; however, I am a bit concerned of inflation overheating and the continuation of record setting asset prices.

Last week three of the four major averages hit all-time record highs. The Dow Jones Industrial Average (see chart here) hit an all-time high of 35171. On Thursday the S&P 500 (see chart here) notched a record high of 4429 and the Nasdaq Composite (see chart here) booked a record high of 14863. The small-cap Russell 2000 (see chart below) is the one index that is lagging a bit but the uptrend there remains intact.

As mentioned above, I am a bit concerned as to the non-stop record setting ways with asset prices. There seems to be a growing concern on the street about the potential ramifications of easy monetary policies that have been in place for over a decade and counting. There is no question interest rates need to go up and the money printing needs to abate. Yes, we are in a once in a century pandemic and there has been no choice other than to flood the markets with stimulus and support. However, this cannot go on forever.

That said, as I look at the technical shape of the aforementioned key indexes, there are currently no problems there. Three of the four indices that just set records last week all remain above their respective 20-day, 100 and 200-day moving averages. Also, these indexes are not yet overbought according to the relative strength index aka the RSI. So, folks it appears the record setting ways of our markets should continue in the near term. Make sure to always consult with a certified financial advisor(s) before making any decisions and/or adjustments to your investment strategies.

Good luck to all 🙂

~George

Nowhere Near Raising Rates - Paula Mahfouz

No June Swoon This Year…

No June swoon this year, these markets are simply not having it. June historically can be either a slow month or a month of selling pressure. Neither really happened this year. Despite a brief dip in the major averages a couple of weeks back due to inflation concerns, stocks and indexes held their own last month. The Dow Jones Industrial Average (see chart here) closed out the month at 34502, the S&P 500 (see chart here) finished the month just shy of 4400, the Nasdaq Composite (see chart here) closed out the month in record territory at 14503 and the small-cap Russell 2000 (see chart below) finished the month and first half of the year at 2310.

I remain in awe of the resiliency of stocks and most every other asset class out there. I read the other day that Facebook (NasdaqGS: FB) has become the fifth company in the United States to surpass the $1 trillion value mark. We now have in our country five companies that are valued at over $1 trillion dollars. Apple (NasdaqGS: AAPL), Amazon (NasdaqGS: AMZN), Microsoft (NasdaqGS: MSFT) and Alphabet aka Google (NasdaqGS: GOOGL) round out the top five trillion-dollar companies. When I see this type of action it makes me wonder how much earnings power do these companies need to continue to exhibit in order to keep their eye-popping valuations going? One other obvious similarity is the companies are all tech stocks and that is where the real growth has been. If you go back 20 years, I don’t think anyone would of expected five companies in our markets all reaching and boasting trillion dollar plus valuations. Heck, Microsoft’s market cap just surpassed $2 trillion dollars to join Apple as the only companies with more than a $2 trillion dollar valuation. Folks I am not a forensic analyst, but my goodness how is the law of large numbers playing a role here?

As I look at the technical shape of the major averages nothing really stands out to me with the exception of the Nasdaq Composite (see chart here). The Nasdaq has just entered overbought territory according to the relative strength index aka the RSI. The Nasdaq also just hit an all-time high so I think some sort of pullback could potentially be in the offing.

Have a safe and happy 4th of July weekend 🙂

~George

No June Swoon This Year - Paula Mahfouz


Does It Feel A Bit Bubbly?

Do the markets feel a bit bubbly to you? This question is beginning to surface more frequently lately and I think it’s a great question to be asking. The majority of asset classes seemingly have gone straight up without pause over the past several months. Whether it’s the stock market as a whole, the crypto space or one of the hottest trends lately are SPAC’s. What is a SPAC? A SPAC is a special purpose acquisition vehicle that is publicly traded but has no assets other than cash. These vehicles are specifically designed to form as a public company, raise capital and then seek out companies to acquire. For example the electric vehicle space has been one of the favorite sectors for SPAC’s to target over the past year. This is a much easier pathway for private companies to go public without having to go through the time and expense of a traditional IPO.

One of the problems that is happening with the SPAC trade is once they identify a target and move to acquire it, the valuations of these SPAC’s begin to rise steadily into the nosebleed section of the markets. So much speculation is occurring with these SPAC’s institutional and retail investors are willing to pay essentially any price to get on board. Let’s not forget about the day traders that add fuel to the rise in these SPAC’s. So between all of the above and now with interest rates starting to tick up, it’s now wonder we have witnessed over a 1000 point drop in the Dow Jones Industrial Average (see chart here) to close out last week. Now let’s look at the technical shape of the major averages.

The Dow Jones Industrial Average (see chart below), the S&P 500 (see chart here), the Nasdaq Composite (see chart here) and the small-cap Russell 2000 (see chart here) over the past few trading sessions have all dropped below their respective 20-day moving averages and are finding support at their 50-day. Let’s see if these key indices can hold their 50-day moving average support zone this week. If they can the uptrend could very well remain intact, if not, we could see late last weeks selling pressure continue.

Good luck to all 🙂

~George

Does It Feel Bubbly? - Paula Mahfouz