The U.S. stock market notched record after record in 2021! What a year for all asset classes from stocks, to real estate, to the crypto markets!
The Dow Jones Industrial Average (see chart here) finished 2021 up 18.7%. The S&P 500 (see chart here) closed the year out up a whopping 27%. The Nasdaq Composite (see chart here) closed up 21.5% and the small-cap Russell 2000 (see chart here) closed 2021 up 13.7%. How counterintuitive are these results as our country and the world for that matter continues to face and deal with Covid-19. Covid is now entering its 3rd year with the latest variant taking the world by storm. The omicron variant are causing infection rates to soar. However, scientists are hopeful that this variant could be the catalyst to ending this pandemic due to how less virulent this variant is at least to the fully vaccinated. It’s still early but the way omicron has now seemingly and abruptly reversed its course in South Africa, there is hope that this will be the case everywhere else.
Back to the markets. As we enter 2022 the big question and maybe the only question the markets have is how aggressive will the Federal Reserve be in hiking interest rates. No question in the new year interest rates will begin to head north. Inflation is soaring and impacting almost everything, which is part of the reason why we are seeing all-time highs across the board. This is not sustainable and with interest rates on the verge of increasing, stocks will face their first true test as the tightening rolls out. That said and because the pandemic is still wreaking havoc, I do not expect the Fed will be too aggressive out of the gate.
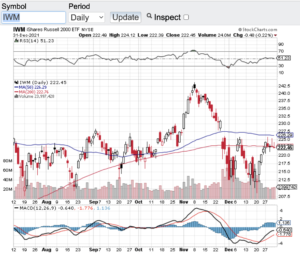
Let’s look at the technical shape of the aforementioned indexes. The Dow Jones Industrial Average (see chart here) is comfortably trading above its 100 and 200-day moving averages as is the S&P 500 (see chart here) and the Nasdaq Composite (see chart here). The small-cap Russell 2000 (see chart below) is trading at it 100 and 200 day MA so let’s see if these support lines hold for the Russell. The other technical indicator that I prefer is the relative strength index aka the RSI and none of the aforementioned indexes are in overbought territory according to the RSI. The 70 value level of the RSI is considered overbought and the 30 value level is considered oversold and each index is trading right around the middle of that range.
Happy New Year!
~George