Strong Earnings – Record Highs!

Last month I asked “Is this a healthy correction or something more?” and based on how strong earnings have been along with record highs, I think it is fair to say last months action was more of a healthy pullback than anything else. The Dow Jones Industrial Average (see chart here) is at an all-time high trading above the 36000 mark, the S&P 500 (see chart here) has also hit an all time high today, the Nasdaq Composite (see chart here) has also joined the all-time high club and the small-cap Russell 2000 (see chart here) is within striking distance of its all-time high.

The most recent catalyst for stocks and indexes hitting their all-time highs are earnings. 80 percent of the companies on the S&P 500 that have reported their Q3 earnings so far have beat Wall Street expectations. There are still 1000’s of companies set to report over the coming weeks but if trend continues we could very well be seeing more records set. Along with a strong earnings reporting season no question the Fed continues to encourage all investors to participate due to how low interest rates remain. For most investors there are not many options right now to generate meaningful returns other than the stock market or the high flying crypto space which remains incredibly volatile and extremely risky.

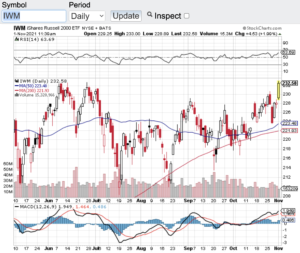
Now let’s take a look at the technical backdrop of the aforementioned indexes. The Dow Jones Industrial Average (see chart here) is trading comfortably above its key moving averages and not quite overbought according to the relative strength index (RSI) and the same can be said for the S&P 500 (see chart here) and the Russell 2000 (see chart below). However, the Nasdaq Composite (see chart here) has just breached the 70 value level of the RSI which is the pure definition of a stock or index becoming overbought. Note, stocks and/or indexes can remain overbought for extended periods of time before a turn.

One of the oldest adages on Wall Street is the trend is your friend and it is clear where the trend has been and where it will most likely go. That said, it is always best to consult with your certified financial planner/advisor if you are considering any portfolio additions, deletions or adjustments.

Good luck to all 🙂

~George
Strong Earnings - Record Highs - Paula Mahfouz

A Breakout Or A Fake-out?

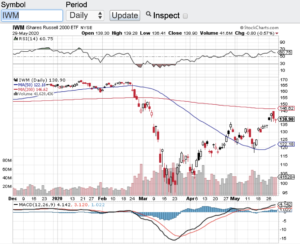
The major averages seemingly are on the verge of a breakout, or could it be a fake-out? The Dow Jones Industrial Average (see chart here) has recaptured the 25000 level. The S&P 500 (see chart here) has recaptured the 3000 level. The Nasdaq Composite (see chart here) believe it or not is in striking distance of its all-time high and the small-cap Russell 2000 (see chart below) is also setting up for a breakout on its own. It is beyond impressive how the markets have come roaring back since late February. There are certain pundits out there that believe that this is a classic bear market rally however to me it feels like more than that. I have to believe that one of the main reasons why stocks have come roaring back in such a short period of time is the $ trillions of dollars in liquidity that the Federal Reserve and our government has injected into the markets and the economy. In fact, the Federal Reserve has quietly indicated that it is possible that they themselves would buy stocks if needed. Talk about establishing a floor in the stock market!

Another key development in the markets is how strong the technicals look right now. Without a doubt the leadership group of this recent rally is the Nasdaq Composite (see chart here). Tech stocks have benefited the most due to the lockdown. There are more people online than ever before, hence more sales accordingly. Since mid-April, not only has the Nasdaq cleared its 200-day moving average, it also has cleared its 50, 100 and 20-day moving averages. So now the Nasdaq is trading above all of its key moving averages which is bullish. Furthermore, the Dow Jones Industrial Average (see chart here) the S&P 500 (see chart here) and the small-cap Russell 2000 have also broken above some key technical resistance levels. Another technical indicator I look at the relative strength index also known as the RSI. At this point in time the aforementioned indexes are not in overbought territory. The RSI is a momentum indicator and when the value level of the RSI goes above 70 stocks or indexes begin to become overbought. This is currently not the case.

Good luck to all 🙂

~George

A Breakout Or A Fake-out - Paula Mahfouz