About A Month Away…

We are about a month away from the election and the markets seemingly don’t care or have any new concerns. Once again both the Dow Jones Industrial Average (see chart here) and the S&P 500 (see chart here) hit records. The Nasdaq Composite (see chart here) and the small-cap Russell 2000 (see chart here) are trading positively as well.

Without question there is even more confidence in the markets now that the Federal Reserve is cutting interest rate. Not only did the Fed cut interest rates by 1/2  point last month, Jerome Powell the Chairman of the Federal Reserve signaled more rate cuts are forthcoming. Couple this new sentiment from the Federal Reserve along with growing confidence in the economy and the job market, it’s no wonder the Dow Jones (see chart here) and the S&P 500 (see chart here) are once again setting all-time highs. Some pundits are beginning to call this a “goldilocks economy” while others are waiting for the next shoe to drop. As far as the next big catalyst is concerned, well clearly it’s the upcoming Presidential election. However, here in October we will begin to see Q3 earnings results being reported from corporate America. This too is expected to be a tell-tale sign of how companies are currently faring and we should definitely see how the consumer is feeling, especially with the rate cut and the positive impact that is having on consumers. This new backdrop should begin trickling down to corporate America revenues and future forecasts.

Let’s take a quick look at the technical shape of the indexes. The Dow Jones Industrial Average (see chart here) and the S&P 500 (see chart here) are trading near the upper end of the trading range they have been in. Please note neither index is in “overbought” territory yet but are approaching the 70 level of the RSI aka the Relative Strength Index. As I look at the Nasdaq Composite (see chart here) and the small-cap Russell 2000 (see chart here), these indexes are finding support at their 20-day moving averages. So technically speaking things look to be ok here too.

Good luck to all 🙂

~George

Earnings And The Election…

Now that the first half of the year is in the books in which we witnessed the markets hitting all-time highs, investor focus should shift to Q2 earnings reporting season and the upcoming election.  Once again the S&P 500 (see chart here) and the Nasdaq Composite (see chart here) hit record highs on Friday to close out the month of June. The Dow Jones Industrial Average (see chart here) is hovering around the 39000 zone, while the small-cap Russell 2000 (see chart here) continues to bounce around the 2000 level.

After the much-anticipated Presidential debate which is the first one in this election year, stocks reacted in a volatile manner on Friday. As mentioned above the S&P 500 (see chart here) and the Nasdaq Composite (see chart here) both set all-time highs on Friday before reversing and closing lower on the day. I am not sure why stocks took off at the open on Friday and set all-time highs especially with how the debate went on Thursday night. I refused to watch the debate for a variety of reasons and from what I am hearing and reading, I am glad I did not watch it. There are no words for what is going on here in our country and I will leave it at that. I’d rather focus on the positive which are the markets and how incredibly resilient they are.

As I look at the back half of the year, stocks should be put to the test from here on out. Q2 earnings reporting season is on deck with most companies reporting their results after the 4th of July holiday. Without question analysts and investors alike will be focused on the health of corporate America and how they are growing their top and bottom lines. This should be one of the main factors on whether this powerful rally continues. The other wild card in the mix is the upcoming election. Depending on how things shake out between now and the actual election, this could have an impact of a “black swan” type event and if this is the case, then we could see one wild ride into year-end.

Good luck to all 🙂

~George
Tech Stocks Hit The Brakes!

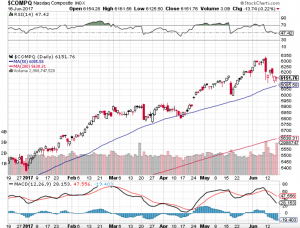
After going up in a straight line for months, the technology sector (see chart below) has reversed its upward course. After hitting an all-time high of 6341.70 on June 9th, the Nasdaq (chart) has given back 190 points or three percent while approaching its 50-day moving average. Nowadays it’s pretty rare to see a one percent pullback in tech stocks let alone a three percent retracement in a week. The media is now all over how tech stocks today are beginning to resemble the internet bubble. The difference between today and yesteryear is that the top five tech stocks – Amazon (NasdaqGC: AMZN), Apple (NasdaqGC: AAPL), Facebook (NasdaqGS: FB) Google’s parent company Alphabet (NasdaqGC: GOOGL) and Microsoft (NasdaqGC: MSFT) have been responsible for a big chunk of the Nasdaq and S&P 500 (chart) recent gains. The problem with comparing today’s market with the internet bubble is that the aforementioned tech leaders all have incredible balance sheets while continuing to grow at a pace that supports their relative stock prices. One may argue that Amazon remains overpriced especially with its lofty P/E ratio.

It’s hard to imagine that anyone would be concerned about a three percent pullback in any stock or index, but because of how strong stocks have been since the election, anything other than a flat to up day will get noticed. That said, without question all eyes will be on whether or not the Nasdaq’s 50-day moving average will get tested. The last time the Nasdaq (chart) did not hold its 50-day support line was last October. Since then tech stocks have tested and moved off of its 50-day average multiple times. 6085 is the current the 50-day moving average of the Nasdaq which is about 65 points away. I am not suggesting it will go there, but if it does and according to the way tech stocks have reacted to that particular support line, a bounce could be in the cards. Good luck to all 🙂

~George

Nasdaq chart - George Mahfouz Jr