Fed Rate Cuts Back In Play?
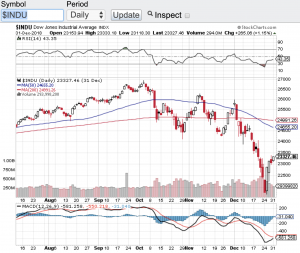
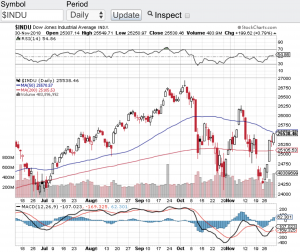
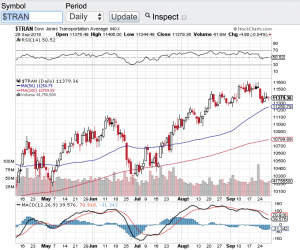
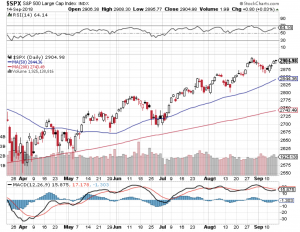
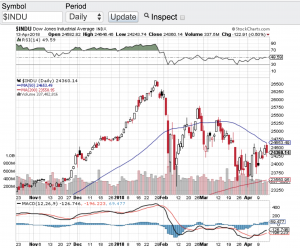
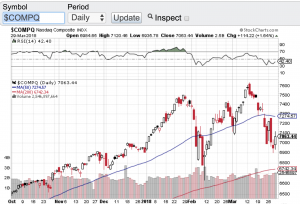
The question over the past week or so is whether or not Fed rate cuts are back in play? The May jobs numbers were way below expectations with the economy only adding 75,000 jobs. This is a far cry from the 180,000 that economists were expecting in the month of May. As intuitive as it seems a weak jobs report should equal a continuing sell-off in the markets. Not the case in the first half of the month for stocks. In fact the Dow Jones Industrial Average (see chart here), the S&P 500 (see chart here), the Nasdaq Composite (see chart here) and the small cap Russell 2000 (see chart below) all have rallied sharply so far this month. So how is it that stocks are rallying with a slowing job market? Two out of the past four months the jobs number has come in below 100,000. This is giving hope to the markets that the Federal Reserve may actually start cutting interest rates as opposed to raising them and this is why the markets are rallying. Lower interest rates has been a boon for stocks for the past decade and if the Fed starts lowering rates again, we could see all-time highs again.
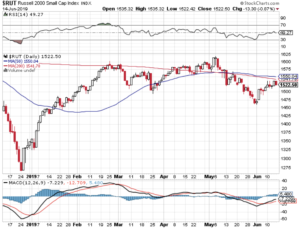
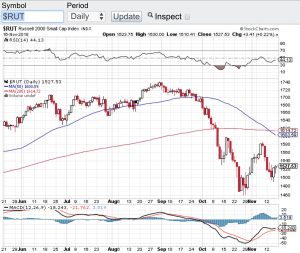
What’s more is the technical shape of the aforementioned key indexes. As stocks have rallied this month, 3 out of the 4 major averages have blown through their moving averages which can provide resistance point if a stock or index is trading below their respective averages. Since the June rally began, the Dow Jones Industrial Average (click here for chart) recaptured it’s 200-day, 100-day and 20-day moving averages as did the S&P 500 ( click here for chart) and the Nasdaq Composite (click here for chart). However the small-cap Russell 2000 (click here for chart) has run into its 100 and 200 day moving averages and has found resistance at these key pivot points.
Let’s see how the rest of June goes and see if this past weeks consolidation will offer yet another leg up in the markets. Good luck to all 🙂
~George