Tech Stocks Under Fire!

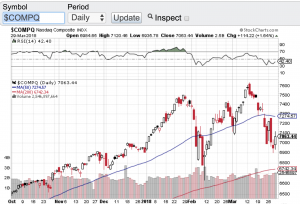
Despite a modest rebound on Friday tech stocks remain under fire. From Facebook (NasdaqGS: FB) to Tesla (NasdaqGS: TSLA) and now even Amazon (NasdaqGS: AMZN) are all under pressure for a variety of reasons. This is spilling over into the overall tech sector (see chart below) and even into the overall marketplace. Facebook is facing significant scrutiny regarding user privacy while Tesla continues to trip up with deliveries and debt issues and now even Amazon is under pressure due to President Trump’s direct attack on the online retailer’s sales tax structure. This was enough to send the major averages down to close out the quarter at or in negative territory. The Dow Jones Industrial Average (chart) finished Q1at 24103, the S&P 500 (chart) closed the quarter at 2640, the Nasdaq Composite (chart) closed at 7063 and the small-cap Russell 2000 (chart) finished the first quarter of the year at 1529.

What was also obvious in Q1 was how volatility came back to life. For years the market was in a lullaby state melting up and setting record after record. Well the first quarter has swiftly reminded us on how markets can and should behave. Investors that placed money into mutual funds or passive funds over the past several years made out like a bandit with not a worry in the world. Abnormal stock market gains were in vogue especially after the election. Now with rising interest rates, the Federal Reserve reducing its debt load and the daily drama out of Washington DC, I think it is safe to say the melt up mode and daily records being set are in the rear view mirror. That said, market corrections are very normal and healthy and so is volatility at least for traders that is 🙂

Looking ahead and with earnings reporting season right around the corner, let’s see how corporate America fared in the first quarter of the year. This could be the catalyst that calms things down a bit but in the same breath should there be any slippage in earnings growth, we could be in for more even more volatility. Good luck to all 🙂

~George
Nasdaq - george mahfouz jr

Record breaking July!

The month of July served up all time highs as Q2 earnings reporting season begins to wind down. For the month, the Dow Jones Industrial Average (chart) closed up 3.50%, the tech-heavy Nasdaq (chart) gained a whopping 6.8%, the S&P 500 (chart) +4.38% and the small-cap Russell 2000 (chart) closed the month up 5.6%. The rally in stocks continue thanks to favorable corporate earnings for the most part, and the Federal Reserve keeping its commitment to do whatever it takes until the economy can stand on its own two feet. Yesterday, after the Federal Reserve’s 2-day policy meeting ended, the central bank reiterated that it would continue its $85 billion per month bond buying program and keep interest rates near zero to help support and strengthen the economy.

That said, August begins with quite the test as all eyes will be on tomorrow’s  jobs report. The July unemployment report should be the most scrutinized report of the year as the Federal Reserve has been on the record recently signaling as to when they may start pulling back on its monthly bond purchases. A stronger than expected report may compel the Fed to begin tapering as early as September. However, if job growth continues to be modest, then I think its safe to say the accommodative policies of the Fed will continue into the foreseeable future. So you may ask what does this all mean to the market? This may become the case where good news in the labor market may be bad news for stocks. I know it seems counterintuitive, however, just the notion in late May that the Fed was considering tapering sooner than later sent the markets down five percent in a matter of a couple of weeks. I think everyone from the hedge fund community to mutual funds to institutional investors and even the individual retail investor have been so reliant on this accommodative Fed, that once the tapering actually begins, we may just see the stock market correction the bears have been anticipating all year long.

Technically speaking, although the markets are seemingly overbought, the key indices are not at extreme overbought conditions, just yet. Let’s take a look at the relative strength index (RSI) on the Dow Jones Industrial Average (chart), the Nasdaq (chart), the S&P 500 (chart) and the Russell 2000 (chart). As you can see, these indexes are trading below the 70 value level which is the level most market technicians consider an extreme level. I personally consider the 75-80 value level as extreme, especially in today’s market environment. That said, it appears there has been some consolidation going on over the past couple of weeks with the aforementioned indexes which have been trading in a pretty tight range.  Just maybe tomorrow’s unemployment report will be the catalyst for stocks to breakout of its recent trading range and begin a new trend. I view a breakdown of the 1650 zone in the S&P 500 (chart) as bearish. However, should the S&P 500 (chart) break and close above 1700 in a meaningful way, we may just see the extreme overbought conditions come into the marketplace as mentioned above. Good luck to all and I wish you all a very profitable month.

All the best 🙂

~George

Flat week…

Despite Thursday’s 250 point Dow drubbing, the key indices closed mixed on the week. The Dow Jones Industrial Average (chart) finished the week down 126.39 points, the Nasdaq (chart) finished up 19.62, the S&P 500 (chart) closed lower by 7.82 points and the Russell 2000 (chart) closed the week out gaining 3.84 points. Equities digested a lot of news this week including the Federal Reserve indicating they are ready to step in should the economy continue to falter. However, certain traders were disappointed the Fed did not provide another round of quantitative easing, hence a significant sell-off ensued on Thursday.

Personally, I think the markets need to quit relying so much on central bank stimulus and begin to focus on corporate earnings, which have been overall quite impressive. We are entering the last trading week of the second quarter which could prompt end of quarter window dressing. Window dressing is a strategy used by certain mutual funds and institutions near the end of the quarter to improve the appearance of their fund(s), this could bode well for the markets. Another potential positive for equities is Q2 earnings reporting season which begins in July. In my opinion, this is a key catalyst in whether or not stocks will stabilize over the summer and hopefully de-emphasize what the central banks may or may not do. Good luck to all.

Have a great weekend 🙂

~George